Gig Companies Accounted for 88% of Seattle's 2025 Labor Standards Remedies
Original analysis of 312 records from the Seattle Office of Labor Standards, June 2016–June 2026 (calendar years; headline: 2025). Published October 20, 2026.
We added up the dollar remedies in the case summaries the Seattle Office of Labor Standards has posted since 2016 and separated app-based network companies such as Uber Eats, DoorDash and Amazon Flex from all other employers.
What Seattle's labor case summaries show
App-based network companies accounted for $19.0 million, or 88%, of the $21.6 million in remedies listed in the Seattle Office of Labor Standards' 2025 resolved-investigation summaries. One Uber Eats settlement of $15.0 million made up 70% of the 2025 total; without it, gig companies' share would have been 61%. Across all summaries from 2016 to mid-2026, gig companies account for $38.1 million of $68.2 million (56%).
- 88%Share of 2025 OLS remedies from gig companies
- $19MAssessed against gig companies in 2025
- 70%Share of 2025 total from one Uber Eats case
Gig companies dominated 2025
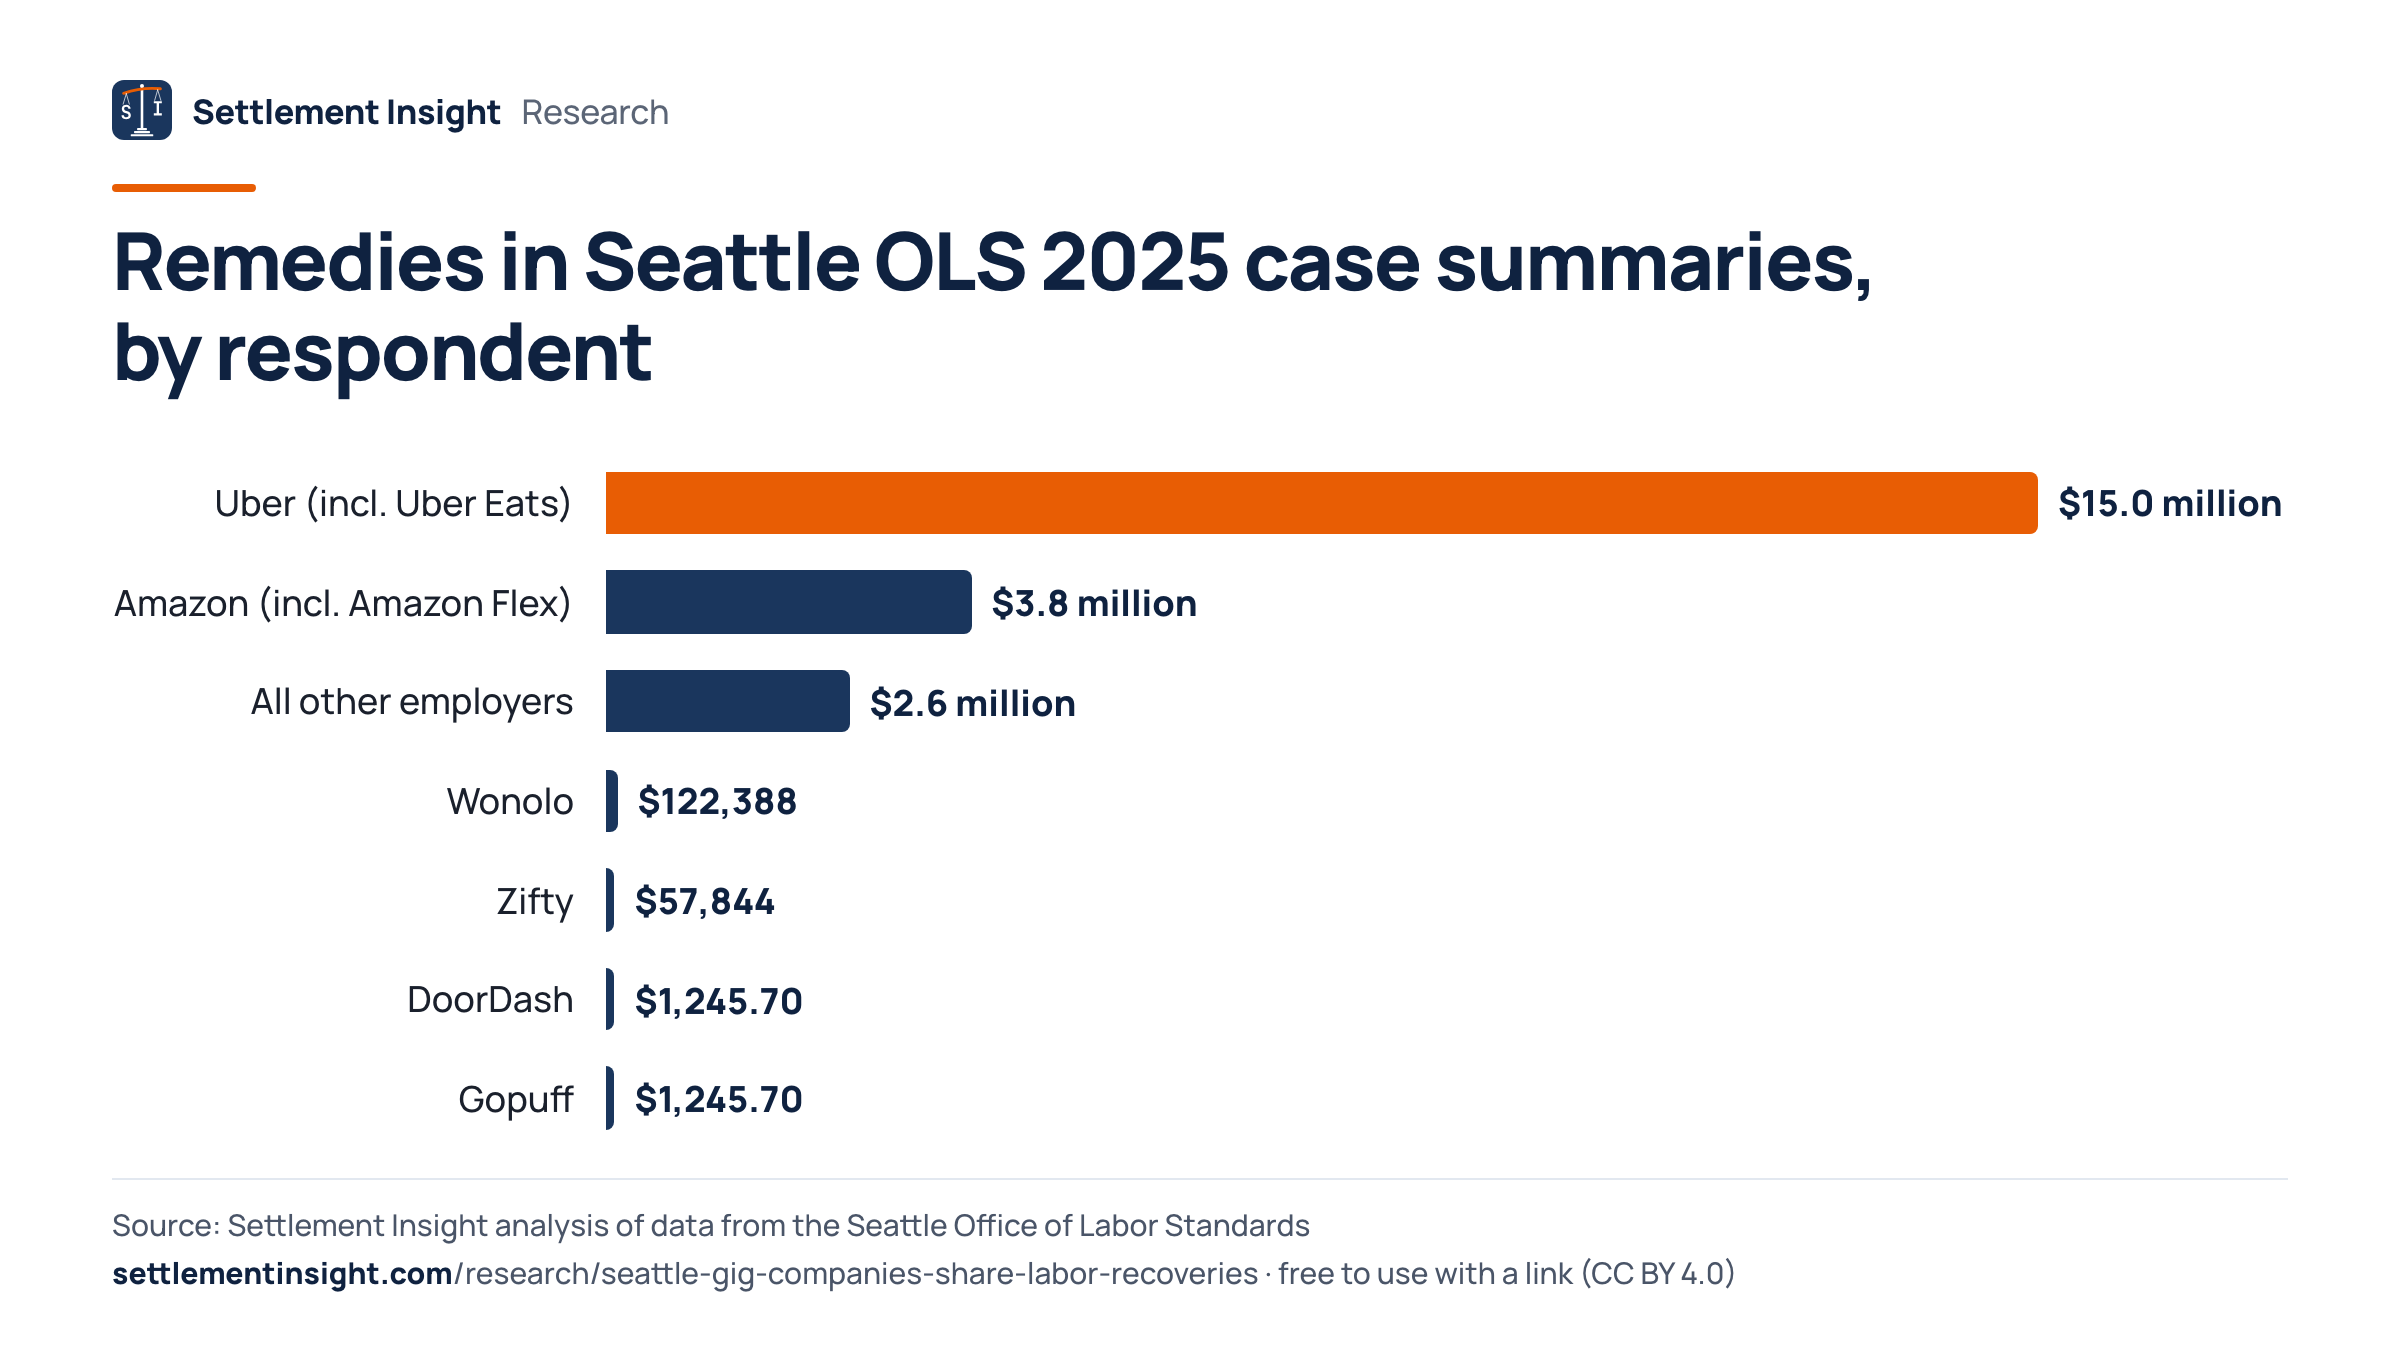
Of the 29 cases in the 2025 summaries, 9 were against app-based network companies, and they accounted for $19.0 million of $21.6 million in remedies (88%). The other 20 employers together accounted for $2.6 million.
One Uber Eats settlement drives the number
Uber Eats settled claims under the Independent Contractor Protections and App-Based Worker Minimum Payment ordinances for $15.0 million, 70% of all 2025 remedies. Amazon's cases, led by a $3.8 million Amazon Flex settlement, added $3.8 million (18%).
Uber leads among gig companies
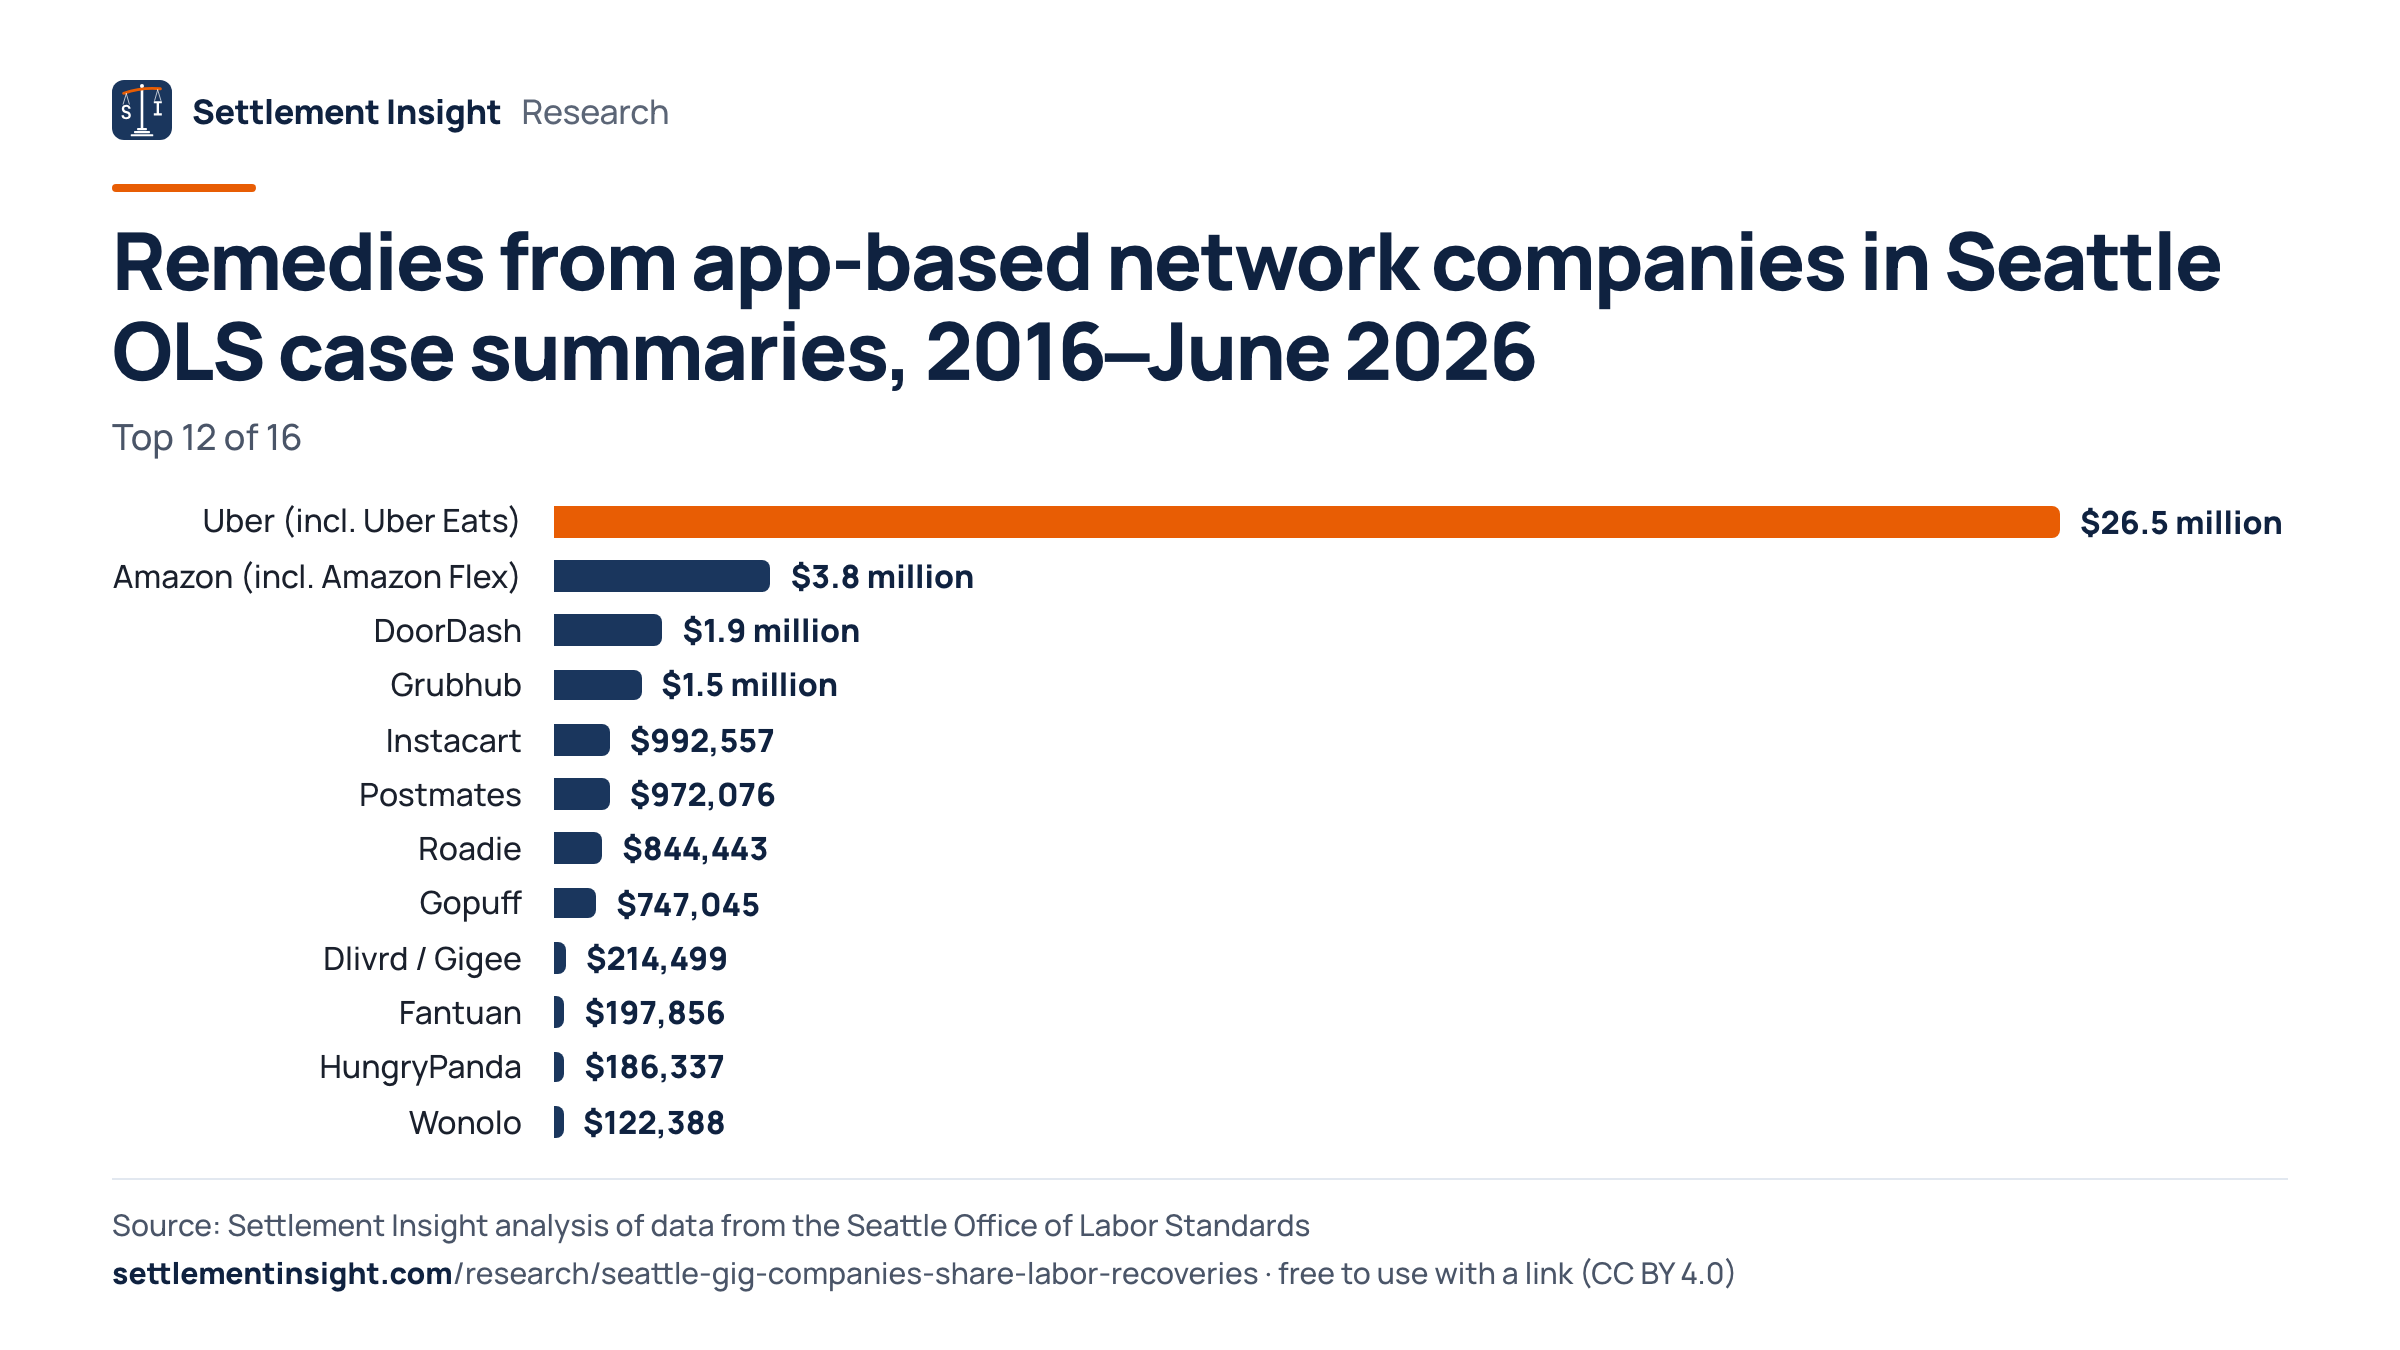
Across all summaries, Uber (including Uber Eats) accounts for $26.5 million in 14 cases, 70% of the money from gig companies and 39% of all remedies listed. Amazon (incl. Amazon Flex) follows with $3.8 million.
The share swings with single cases
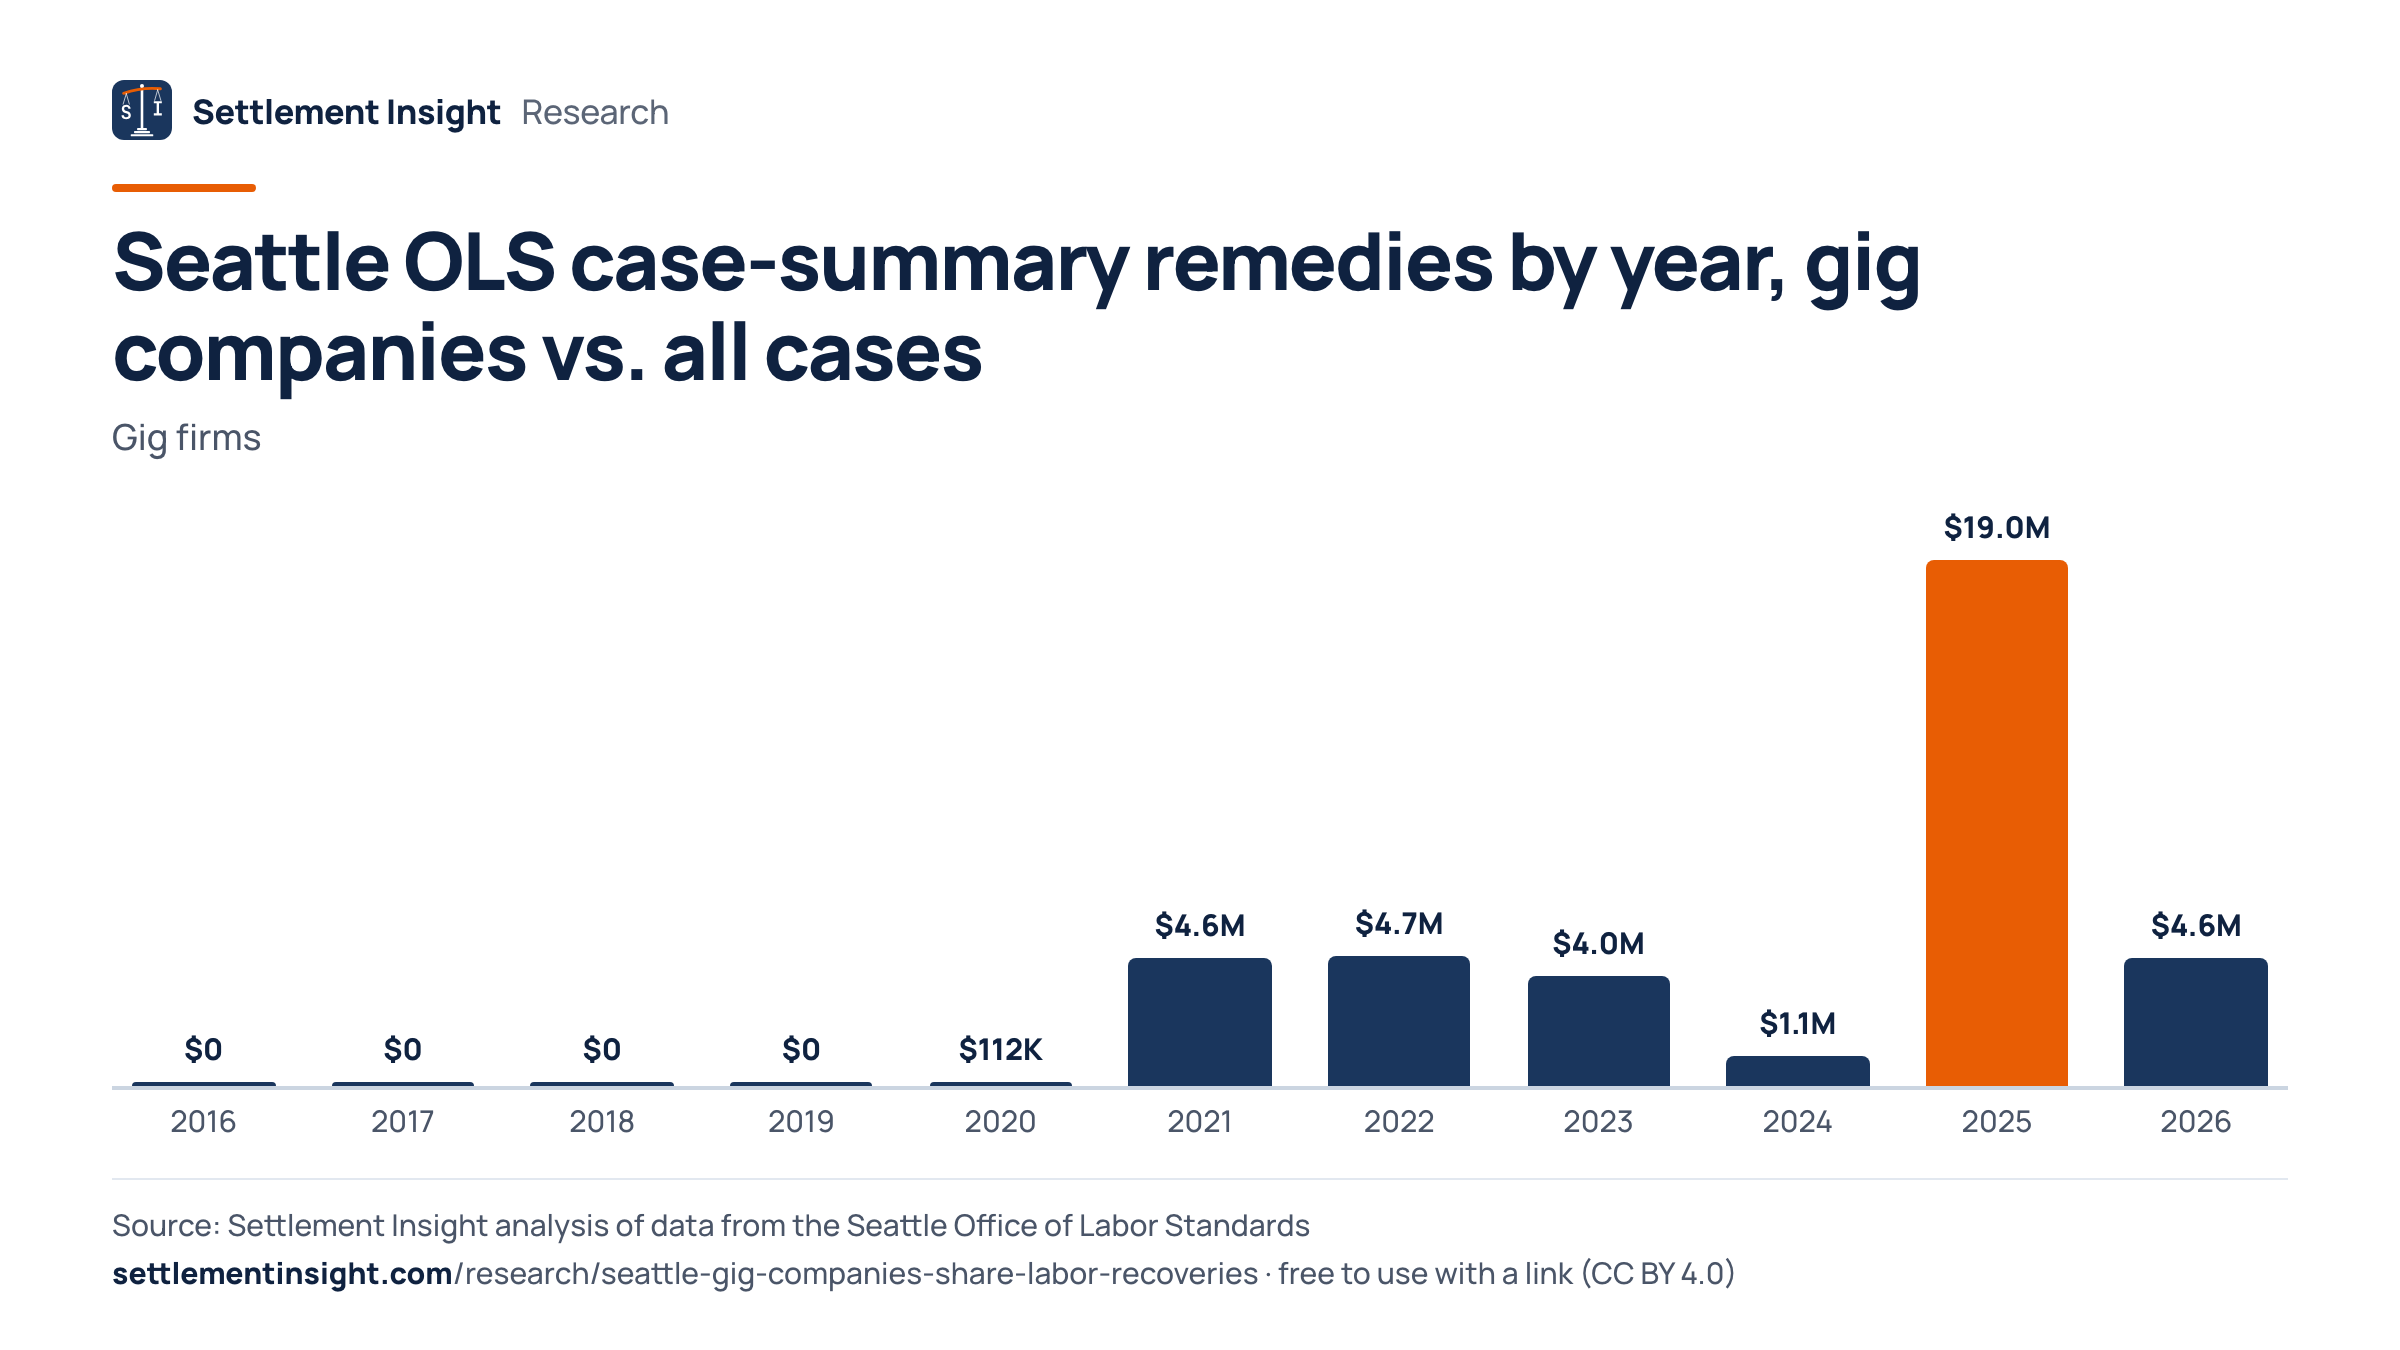
Gig companies' share was 40% in 2021, 68% in 2022 and 79% in 2023 (January–September only; OLS posted no October–December page), fell to 16% in 2024 and rose to 88% in 2025. The 117 cases posted before 2020 include no gig company case.
The 2025 total matches OLS's own figure
The 2025 summaries add up to $21.6M, within 0.30% of the $21.7M OLS reports as assessed in 2025 investigations.
What Share of Seattle's 2025 Labor Recoveries Came From Gig Companies
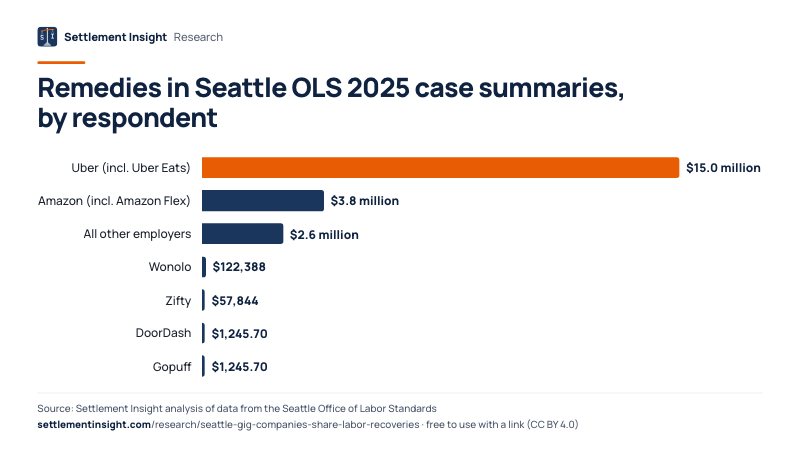
Bars show the remedies in the 2025 OLS case summaries by respondent; all employers that are not app-based network companies are combined in one bar.
Gig companies accounted for 88% of 2025 remedies: $19.0 million of $21.6 million.
The Seattle Office of Labor Standards (OLS) enforces the city's minimum wage, paid sick time, scheduling and wage theft laws and a set of ordinances that cover app-based workers who deliver food, groceries and packages or drive for ride-hail companies. In its four quarterly summaries for 2025, OLS listed 29 resolved cases with dollar remedies totaling $21.6 million. Cases against app-based network companies accounted for $19.0 million of that, or 88%.
Two companies account for nearly all of it. Uber Eats, which OLS says had approximately 35,000 Seattle workers in 2023, settled for $15.0 million, 70% of the 2025 total. Amazon's four cases, three involving Amazon Flex, came to $3.8 million. Without the Uber Eats settlement, gig companies' share of 2025 remedies would have been 61%. The largest 2025 case against any other employer was $567,361.
The comparison is by dollars, not by the number of workers or businesses: the large gig settlements each covered thousands of workers, while many cases against other employers involved a single location.
Remedies in Seattle OLS 2025 case summaries, by respondent
- Uber (incl. Uber Eats)$15.0 million1 case · 69.61% of 2025
- Amazon (incl. Amazon Flex)$3.8 million4 cases · 17.72% of 2025
- All other employers$2.6 million20 cases · 11.82% of 2025
- Wonolo$122,3881 case · 0.57% of 2025
- Zifty$57,8441 case · 0.27% of 2025
- DoorDash$1,245.701 case · 0.01% of 2025
- Gopuff$1,245.701 case · 0.01% of 2025
How the Gig Company Share Has Changed Since 2016
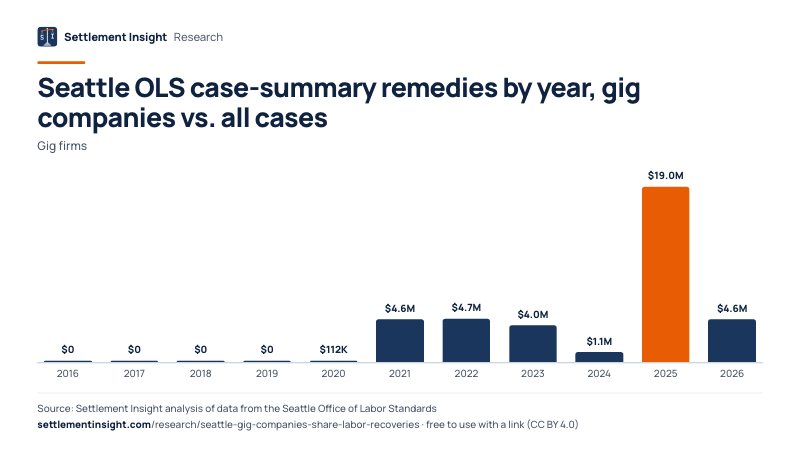
The table shows remedies against gig companies, all remedies and the gig share for each year of OLS case summaries.
Gig companies' share went from none before 2020 to 40% in 2021, 68% in 2022, 16% in 2024 and 88% in 2025.
The 117 cases OLS posted from 2016 through 2019 include no case against an app-based network company. The first appear in 2020, when they made up 1% of remedies. In 2021 an Uber settlement under the Gig Worker Paid Sick and Safe Time Ordinance and a Postmates settlement lifted the share to 40%. In 2022 and 2023 gig companies accounted for 68% and 79% of remedies (2023 covers January–September only), driven by settlements with Uber Eats, Gopuff, DoorDash and Grubhub. In 2024, when a $6.7 million year included a large Chipotle scheduling settlement, the gig share was 16%.
For 2020 through 2025 combined, gig companies account for $33.5 million of $59.3 million (57%). Because a single settlement can exceed all other cases in a year, the yearly share moves with individual cases rather than following a steady trend.
The first half of 2026 shows $4.6 million from gig companies out of $4.7 million, including a second Uber Eats minimum-payment settlement of $4.4 million. Since its October–December 2025 summaries, OLS has also listed 19 small cases under the App-Based Worker Deactivation Rights Ordinance, none above $1,278.16.
Seattle OLS case-summary remedies by year, gig companies vs. all cases
| Year | Gig firms | All cases | Gig share |
|---|---|---|---|
| 2016 | $0 | $304K | 0% |
| 2017 | $0 | $13K | 0% |
| 2018 | $0 | $1.9M | 0% |
| 2019 | $0 | $2.0M | 0% |
| 2020 | $112K | $7.6M | 1% |
| 2021 | $4.6M | $11.3M | 40% |
| 2022 | $4.7M | $6.9M | 68% |
| 2023 | $4.0M | $5.1M | 79% |
| 2024 | $1.1M | $6.7M | 16% |
| 2025 | $19.0M | $21.6M | 88% |
| 2026 | $4.6M | $4.7M | 98% |
Years follow the quarter in which OLS posted the summary, including the lead summary OLS shows for each quarter on its index page. 2016 covers June to December only, 2017 covers January to May only (OLS posted no summaries for June 2017 through December 2017), 2026 covers January to June only, and OLS posted no October–December 2023 page.
Which Gig Companies Paid the Most in Seattle
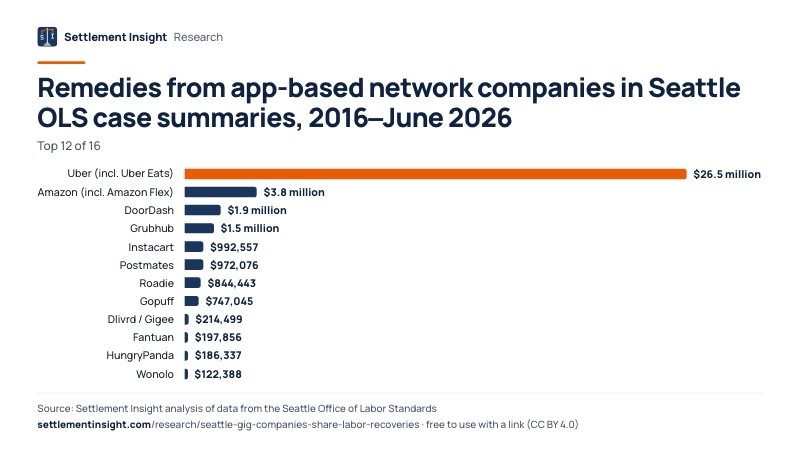
Bars rank app-based network companies by total remedies across all OLS case summaries from 2016 to June 2026, including the quarter lead summaries on the OLS index page.
Uber, including Uber Eats, accounts for $26.5 million, 70% of all remedies from gig companies.
The summaries name 16 app-based network companies in 54 cases. Uber, including its Uber Eats delivery business (Portier, LLC), accounts for $26.5 million in 14 cases, 70% of the $38.1 million from gig companies. Amazon (incl. Amazon Flex) follows with $3.8 million, then DoorDash with $1.9 million. The top three account for 85% of the gig total.
Uber's total includes an April–June 2021 summary that appears only on the OLS index page, in which Uber settled allegations under the Gig Worker Paid Sick and Safe Time Ordinance for over $3.4 million. Postmates is listed separately, as OLS lists it. Totals are not adjusted for company size or the number of Seattle workers each company engages.
Remedies from app-based network companies in Seattle OLS case summaries, 2016–June 2026
- Uber (incl. Uber Eats)$26.5 million14 cases · largest $15.0 million
- Amazon (incl. Amazon Flex)$3.8 million7 cases · largest $3.8 million
- DoorDash$1.9 million8 cases · largest $1.6 million
- Grubhub$1.5 million5 cases · largest $1.5 million
- Instacart$992,5574 cases · largest $730,041
- Postmates$972,0761 case · largest $972,076
- Roadie$844,4432 cases · largest $822,159
- Gopuff$747,0455 cases · largest $735,239
- Dlivrd / Gigee$214,4991 case · largest $214,499
- Fantuan$197,8561 case · largest $197,856
All gig companies
- HungryPanda$186,3371 case · largest $186,337
- Wonolo$122,3881 case · largest $122,388
- Zifty$57,8441 case · largest $57,844
- DeliverThat$27,4071 case · largest $27,407
- Lyft$1,428.141 case · largest $1,428.14
- Rover$1,278.161 case · largest $1,278.16
Download the Data and Cite This Study
Every table as a CSV file and in one Excel workbook, a short PDF summary and every chart as an image, free to reuse with attribution (CC BY 4.0).
- Seattle OLS remedies in 2025 by respondentDollar remedies in the 2025 OLS resolved-investigation summaries per app-based network company, with all other employers combined in one row. · 7 rows · CSV, 1 KB
- Seattle OLS remedies from app-based network companies, by companyCases and dollar remedies per app-based network company across all OLS resolved-investigation summaries from June 2016 to June 2026; index_page_cases counts lead summaries taken from the OLS index page. · 16 rows · CSV, 1 KB
- Seattle OLS resolved-investigation remedies by year, gig vs. other employersCases and dollar remedies in the Office of Labor Standards resolved-investigation summaries (quarterly pages plus the quarter lead summaries on the index page) by posting year, split into app-based network companies and all other employers. · 11 rows · CSV, 1 KB
- All tables in one Excel workbookOne sheet per table plus an About sheet with sources, method and citation · Excel (.xlsx), 12 KB
- Summary to print or forward (3 pages)Short answer, key figures, main chart, findings, method and citation · PDF, 201 KB
Charts for your story
Remedies in Seattle OLS 2025 case summaries, by respondent
Embed this chart
Seattle OLS case-summary remedies by year, gig companies vs. all cases
Embed this chart
Remedies from app-based network companies in Seattle OLS case summaries, 2016–June 2026
Embed this chart
How to cite
Goldberg, L. (2026). Seattle Office of Labor Standards — remedies from gig companies vs. other employers, by year and company (2016–2026) [Data set]. Settlement Insight. https://settlementinsight.com/research/seattle-gig-companies-share-labor-recoveries
BibTeX
@dataset{goldberg_2026_seattle_gig_companies_share_labor_recoveries,
  author    = {Goldberg, Leonard},
  title     = {Seattle Office of Labor Standards --- remedies from gig companies vs. other employers, by year and company (2016--2026)},
  year      = {2026},
  publisher = {Settlement Insight},
  url       = {https://settlementinsight.com/research/seattle-gig-companies-share-labor-recoveries}
}How We Measured
Checked against published figures
- Total amount assessed in OLS investigations, calendar 2025 (sum of all 2025 resolved-investigation summaries): published $21.7M, our count $21.6M (0.30% apart).Seattle Office of Labor Standards, 2025 Year in Review
Full method and limits of the data
A case counts as a gig company case when it was brought under one of Seattle's gig or app-based worker ordinances (Premium Pay for Gig Workers, Paid Sick and Safe Time for Gig Workers, App-Based Worker Paid Sick and Safe Time, App-Based Worker Minimum Payment, App-Based Worker Deactivation Rights, and the transportation network company driver ordinances) or when OLS describes the respondent as a network company. Cases against platform-based businesses under other ordinances, such as a Domestic Workers Ordinance case against Handy and a Fair Chance Employment case against BlueCrew, are counted with other employers.
The amount per case is the total remedy OLS states in the summary: back pay, interest, liquidated damages, civil penalties and, where OLS includes them in the stated total, fines and paid sick time credits. Years follow the posting quarter. Where OLS names fines separately from the total remedy, as in the Amazon Flex case, the fines are not added. The share is the remedy total for gig company cases divided by the total for all cases in the same year. The 2025 total of $21.6M is within 0.30% of the $21.7M OLS's 2025 Year in Review reports as assessed in investigations.
What this data cannot tell you
- OLS calls these pages summaries of "just some" of its closed investigations. For 2025 they match OLS's annual total, and for 2017 through 2025 the summaries add up to $63.2 million, about 96% of the $65.7 million OLS reports as assessed since 2017. Shares for earlier years may therefore differ from shares of all OLS enforcement.
- Remedies are amounts agreed in settlements or ordered by OLS, not confirmed payments, and some include paid sick time credits rather than cash.
- Dates are the quarter in which OLS posted a summary, not the date a case closed. There is no October–December 2023 page, so 2023 covers January–September only. The 17 lead summaries from the OLS index page are dated by the quarter heading they appear under.
- The first half of 2026 is incomplete: OLS posts summaries after each quarter ends, so later 2026 cases are not yet included, and a half-year share is not comparable with full years.
- A single settlement can decide a year's share, so year-to-year changes reflect individual cases, not a measured change in compliance. The data do not show how many violations occurred, only what OLS resolved and summarized.
Frequently Asked Questions
How much has the Seattle Office of Labor Standards recovered from gig companies?
The OLS resolved-investigation summaries from 2016 to June 2026 list $38.1 million in remedies from app-based network companies, 56% of the $68.2 million listed for all employers. In 2025 alone the figure was $19.0 million.
What was the Uber Eats settlement with Seattle in 2025?
Uber Eats (Portier, LLC) settled claims under Seattle's Independent Contractor Protections and App-Based Worker Minimum Payment ordinances for $15.0 million, according to OLS. That one case was 70% of all remedies in OLS's 2025 case summaries.
How much did Amazon Flex pay in the Seattle settlement?
OLS lists an Amazon Flex settlement of $3.8 million under the gig worker premium pay and paid sick time ordinances in its October–December 2025 summaries. With three smaller cases, Amazon accounted for $3.8 million of 2025 remedies.
What is Seattle's app-based worker minimum payment ordinance?
It is one of several Seattle ordinances for app-based workers that OLS enforces, alongside paid sick time, premium pay and deactivation rights rules. Cases under these ordinances and against network companies accounted for 88% of OLS's 2025 remedies.
How much did the Seattle Office of Labor Standards assess in 2025?
OLS's 2025 Year in Review reports $21.7M assessed in investigations. The 2025 case summaries add up to $21.6M.
Which gig company has paid Seattle the most in labor cases?
Uber, including Uber Eats, accounts for $26.5 million across 14 cases in the OLS summaries, 70% of all remedies from gig companies. Amazon (incl. Amazon Flex) is next with $3.8 million.
Sources
- Resolved Investigations (quarterly case summaries) — City of Seattle, Office of Labor Standards
- 2025 Year in Review — City of Seattle, Office of Labor Standards
- Resolved Investigations: July–September 2025 — City of Seattle, Office of Labor Standards
- Resolved Investigations: October–December 2025 — City of Seattle, Office of Labor Standards
- Resolved Investigations: April–June 2026 — City of Seattle, Office of Labor Standards
 Independent analysis. Settlement Insight is not a law firm and not affiliated with any agency named here. Analysis by Leonard Goldberg, Editor. How we work: methodology, our data.
More Research and Data
Other studies from our database of public legal records — each with free CSV downloads.
Related research
Latest studies
- Debt collector lawsuit complaintsEncore (Midland) drew 1,034 CFPB debt-lawsuit complaints in 2024–2025, more than any other company
- Repeat plaintiffs in housing suitsOne organization was first plaintiff in 17.5% of federal housing discrimination cases, FY2021–FY2025
- Identity Theft Debt ComplaintsEquifax, TransUnion and Experian: 47% of 2025 identity-theft debt collection complaints to the CFPB
- PFAS Makers in Land Lawsuits28.0% of FY2025 federal torts-to-land case records, incl. MDL transfers, named a PFAS maker first