Restaurant Wage Theft: Which Chains Have the Most Labor Department Cases
Original analysis of 65,923 records from the Labor Department's Wage and Hour Division, FY2005–FY2025. Published October 15, 2026.
We matched the 65,923 concluded Wage and Hour Division cases in restaurants and other food services, FY2005–FY2025, to 86 restaurant brands by trade name and counted cases, back wages and employees.
What the federal case file shows
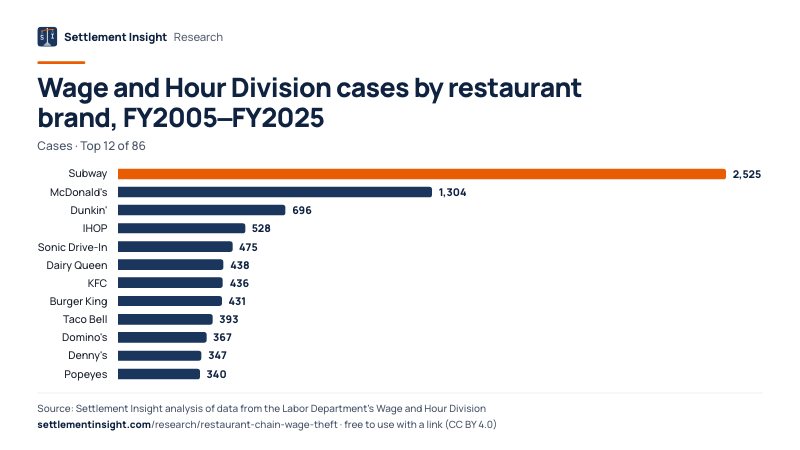
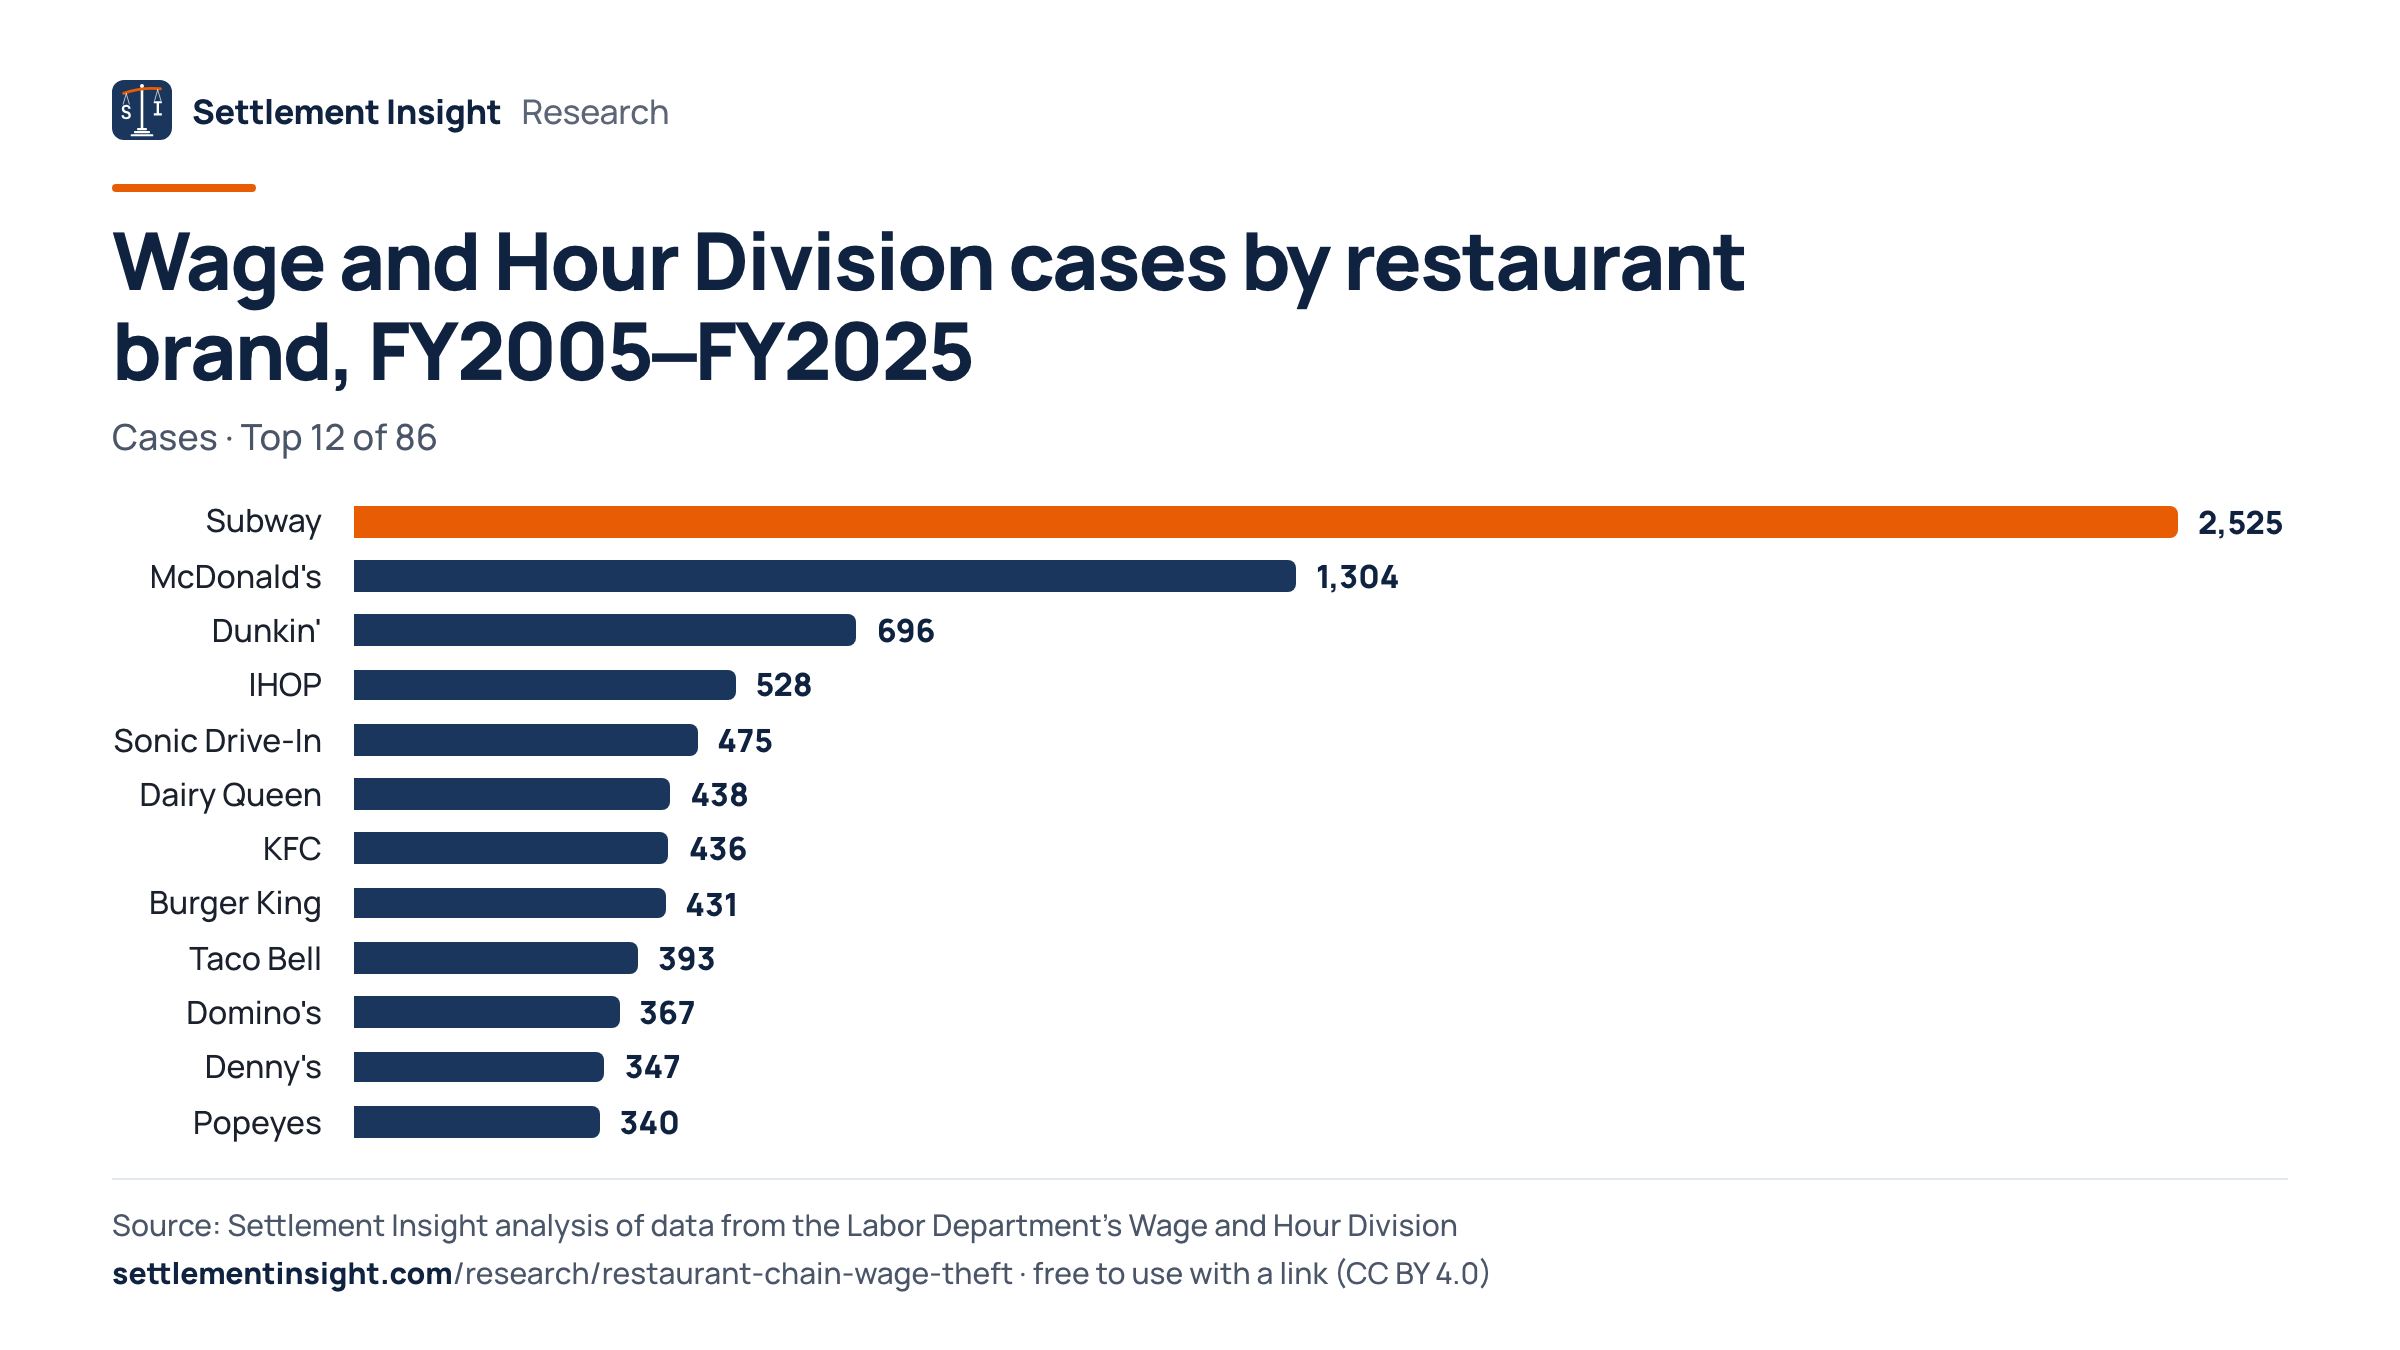
Restaurants operating under the Subway brand account for more U.S. Labor Department wage cases than any other restaurant brand: 2,525 concluded cases with findings periods ending in fiscal 2005–2025, 1.9× as many as McDonald's (1,304), with $7.8 million in back wages. The 86 chains we identified account for 21.3% of all 65,923 food service cases but 7.5% of the back wages. The counts do not adjust for how many locations each brand has.
- 2,525Wage cases at Subway restaurants, FY2005–FY2025
- $7.8MBack wages in Subway cases, FY2005–FY2025
- 21%Food service cases at our 86 listed chains
Subway ranks first by cases
The Wage and Hour Division concluded 2,525 cases at Subway restaurants in 49 of the fifty states, 3.8% of all food service cases, more than at McDonald's (1,304) and Dunkin' (696) combined.
Subway also leads by back wages
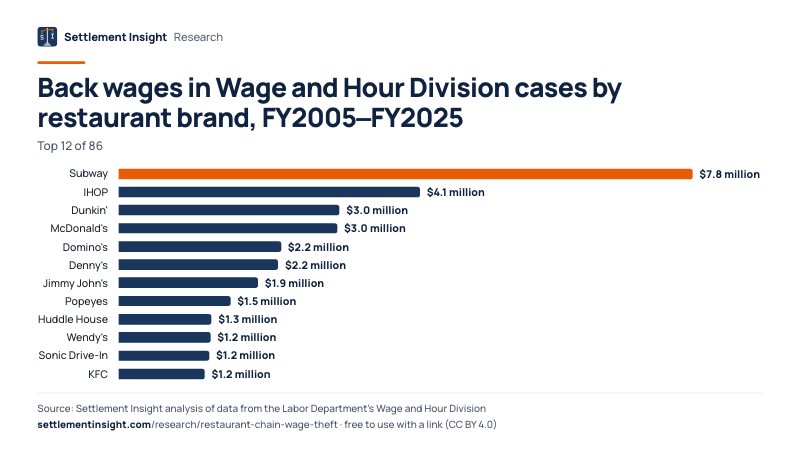
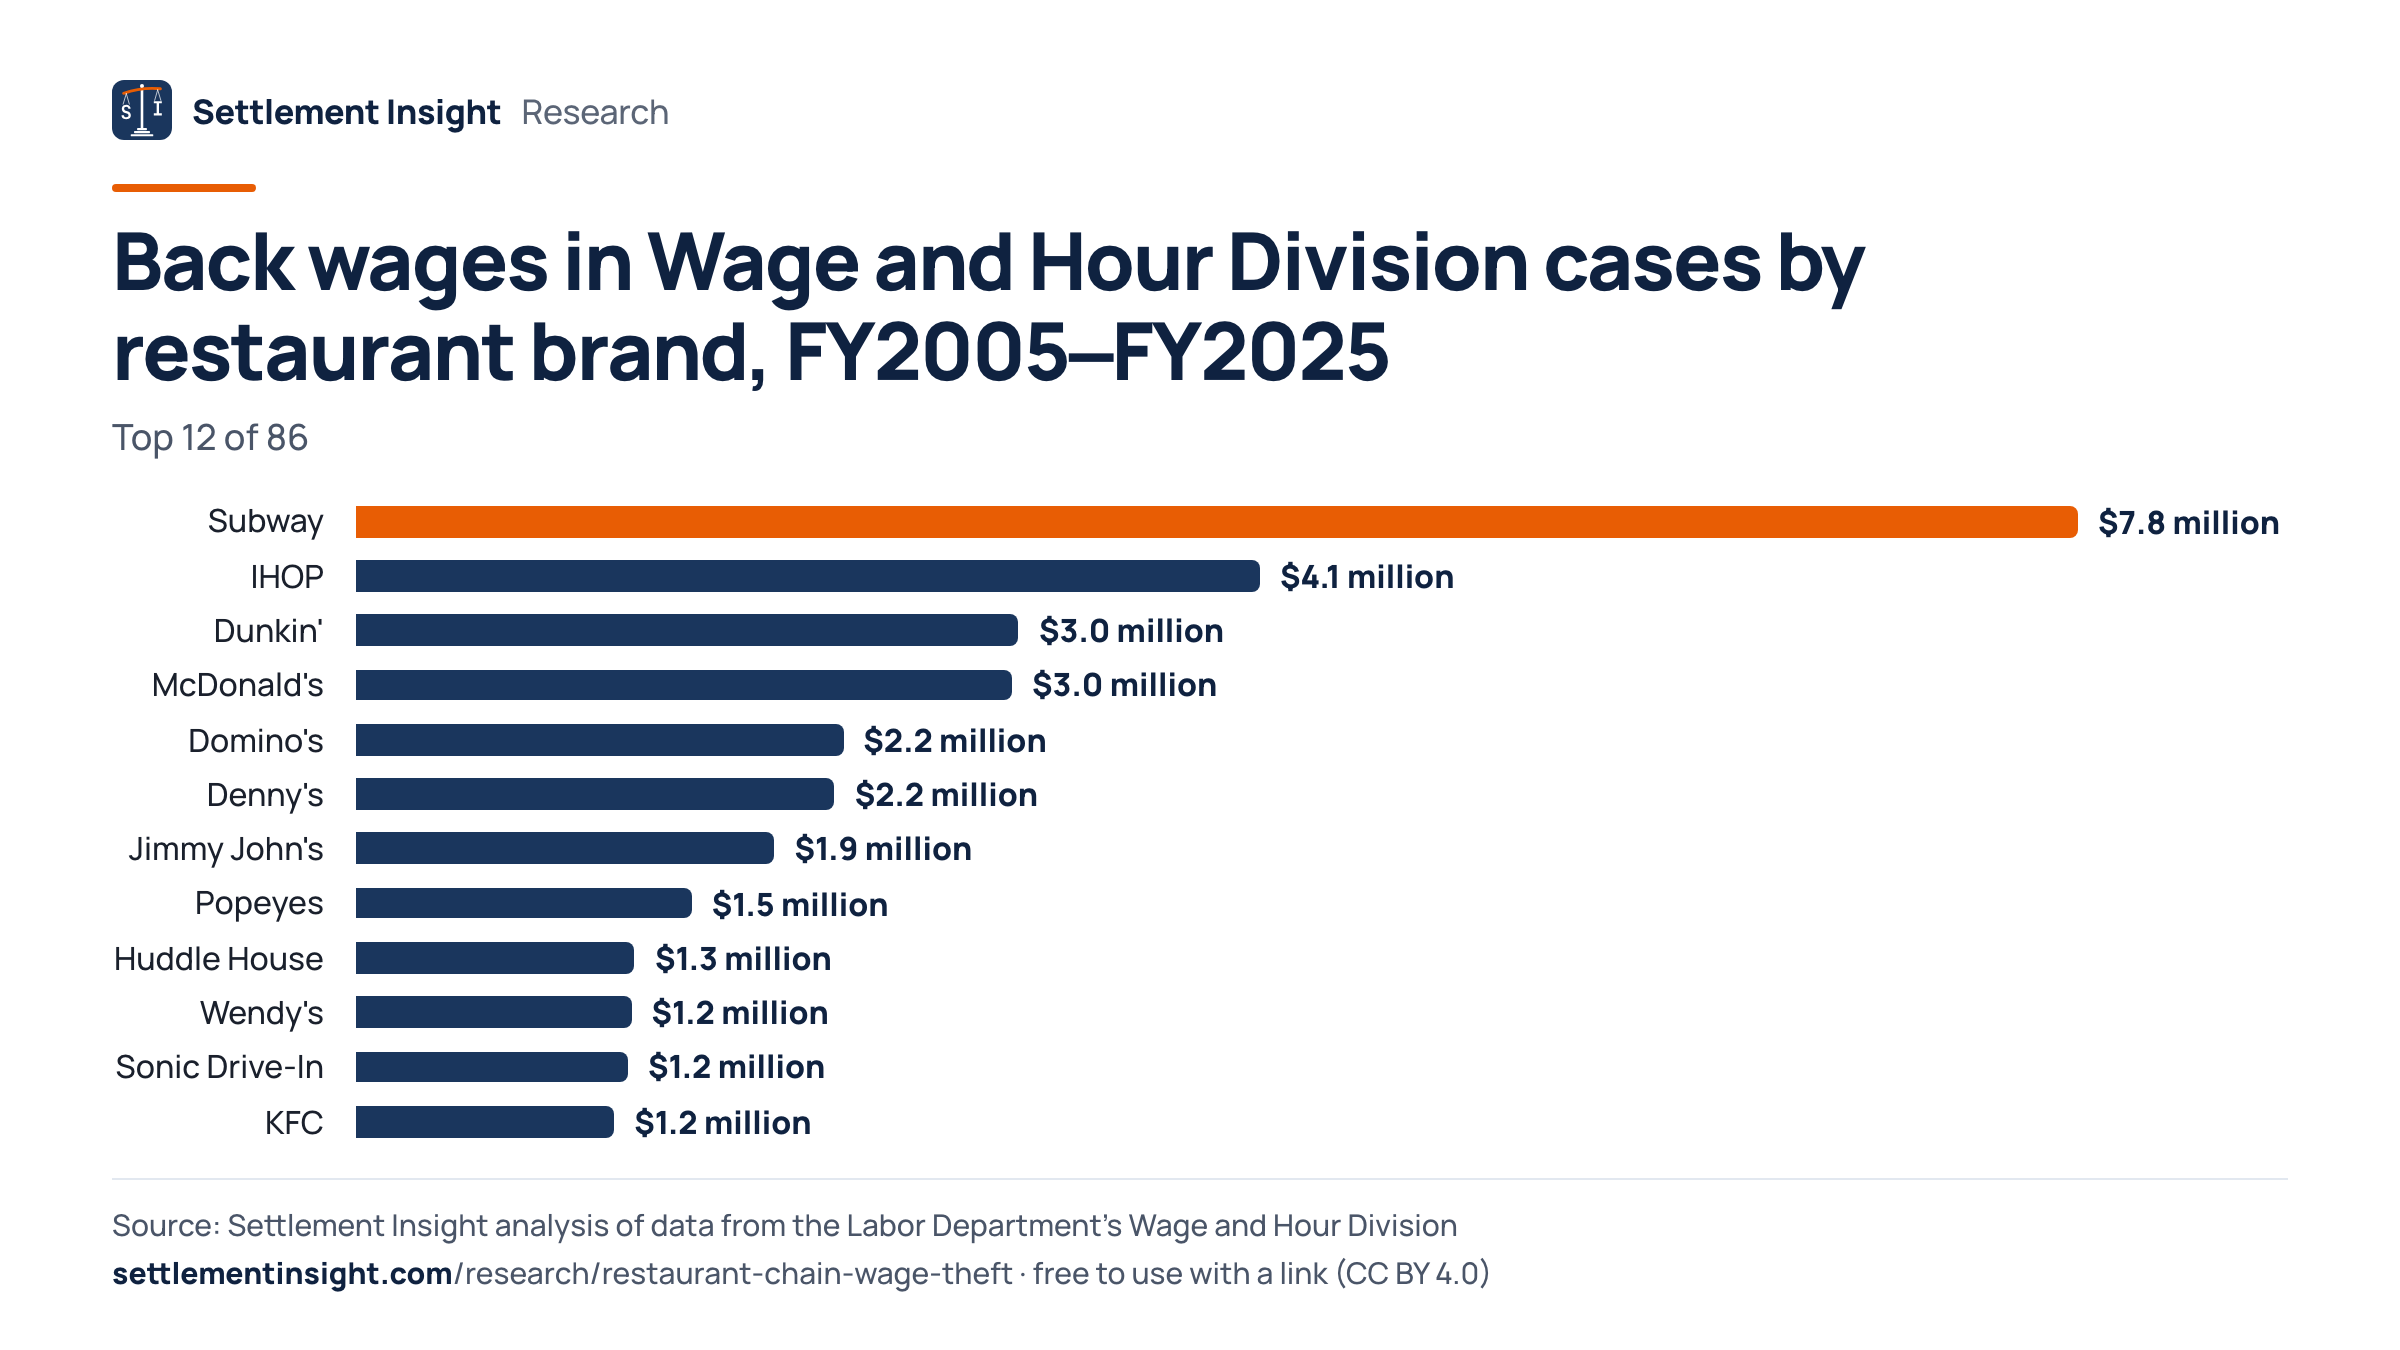
Cases at Subway restaurants carried $7.8 million in back wages, followed by IHOP ($4.1 million) and Dunkin' ($3,007,140). McDonald's ranks second by cases but fourth by back wages ($2,968,840).
Chains are a minority of the caseload
The 86 named chains account for 14,066 of 65,923 food service cases (21.3%) and $46.1 million of $614.8 million in back wages (7.5%). The other cases are at employers whose trade name carries none of these brands.
Chain cases are smaller
When back wages were found due, the median chain case involved $1,501, against $4,756 at other food service employers. Back wages were found in 54.1% of chain cases and 62.6% of the others.
Chains' share of cases by year
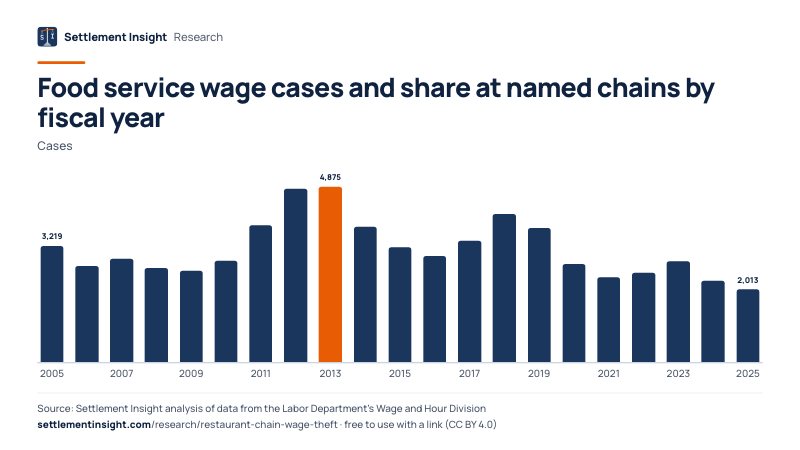
In every complete fiscal year from 2005 to 2023, the named chains accounted for between 15.0% and 26.7% of food service cases. Cases at Subway restaurants reached their high in fiscal 2013 (281).
Which Restaurant Chains Have the Most Wage Violation Cases
The ranking counts concluded Wage and Hour Division cases at food service employers whose trade name carries a restaurant brand, for findings periods that ended in fiscal 2005 through 2025.
Subway (2,525 cases), McDonald's (1,304) and Dunkin' (696) have the most cases. The ten brands with the most cases account for 54.0% of all chain cases.
A case is one concluded compliance action, the unit the WHD itself counts. One investigation of a multi-unit operator can also appear as several records, one per location, with the same employer and the same findings period; this is more common among Subway cases than in food services overall, so the brand counts measure compliance actions, not separate investigations. The employer investigated is the legal entity that runs the restaurant, which for franchised brands can be a local franchise operator rather than the brand's parent company; the brand appears only in the trade name. One case can cover several locations: the WHD case against the operator of Subway restaurants in the San Francisco Bay Area that we use for calibration covered fourteen restaurants.
The ranking does not adjust for the number of restaurants under each brand, which the case file does not contain. A brand with more U.S. locations has more restaurants that can be investigated. Not every case ends with back wages: they were found due in 71.5% of Subway cases and in 40.8% of McDonald's cases.
Wage and Hour Division cases by restaurant brand, FY2005–FY2025
| Brand | Cases | Back wages | Employees |
|---|---|---|---|
| Subway | 2,525 | $7.8M | 27,150 |
| McDonald's | 1,304 | $3.0M | 24,417 |
| Dunkin' | 696 | $3.0M | 5,552 |
| IHOP | 528 | $4.1M | 17,097 |
| Sonic Drive-In | 475 | $1.2M | 9,248 |
| Dairy Queen | 438 | $1.0M | 3,720 |
| KFC | 436 | $1.2M | 3,724 |
| Burger King | 431 | $978K | 4,505 |
| Taco Bell | 393 | $1.0M | 3,949 |
| Domino's | 367 | $2.2M | 5,745 |
| Denny's | 347 | $2.2M | 7,481 |
| Popeyes | 340 | $1.5M | 4,822 |
| Wendy's | 325 | $1.2M | 4,912 |
| Pizza Hut | 314 | $776K | 3,260 |
| Little Caesars | 265 | $505K | 3,554 |
Show all brands
| Brand | Cases | Back wages | Employees |
|---|---|---|---|
| Huddle House | 259 | $1.3M | 5,069 |
| Jimmy John's | 237 | $1.9M | 7,087 |
| Arby's | 217 | $609K | 3,453 |
| Papa John's | 205 | $726K | 3,201 |
| Quiznos | 181 | $246K | 743 |
| Waffle House | 174 | $111K | 642 |
| Chick-fil-A | 168 | $137K | 1,812 |
| Church's Chicken | 167 | $679K | 1,764 |
| Golden Corral | 140 | $417K | 2,042 |
| Marco's Pizza | 133 | $491K | 3,465 |
| Jack in the Box | 128 | $424K | 1,008 |
| Applebee's | 120 | $531K | 2,894 |
| Wingstop | 114 | $480K | 988 |
| Auntie Anne's | 110 | $75K | 512 |
| Five Guys | 107 | $894K | 3,999 |
| Checkers/Rally's | 98 | $263K | 1,958 |
| Zaxby's | 98 | $164K | 1,796 |
| Baskin-Robbins | 97 | $225K | 879 |
| Hardee's | 97 | $219K | 1,164 |
| Jersey Mike's | 93 | $115K | 629 |
| Moe's Southwest Grill | 86 | $244K | 684 |
| Buffalo Wild Wings | 74 | $181K | 1,156 |
| Cici's Pizza | 74 | $240K | 925 |
| Firehouse Subs | 73 | $40K | 576 |
| Tropical Smoothie Cafe | 73 | $238K | 1,066 |
| Dickey's Barbecue Pit | 63 | $182K | 328 |
| Cold Stone Creamery | 62 | $40K | 521 |
| Outback Steakhouse | 62 | $56K | 243 |
| Shipley Do-Nuts | 60 | $188K | 134 |
| Hungry Howie's | 59 | $75K | 465 |
| Chuck E. Cheese | 56 | $165 | 78 |
| Long John Silver's | 55 | $86K | 312 |
| Chipotle | 50 | $20K | 61 |
| Texas Roadhouse | 50 | $200K | 831 |
| Culver's | 48 | $35K | 583 |
| Sbarro | 47 | $7K | 67 |
| Blaze Pizza | 44 | $187K | 547 |
| Perkins | 44 | $114K | 451 |
| Tim Hortons | 44 | $115K | 487 |
| Jet's Pizza | 43 | $173K | 883 |
| Taco John's | 43 | $46K | 244 |
| Chili's | 42 | $58K | 192 |
| Steak 'n Shake | 41 | $71K | 748 |
| Panera Bread | 38 | $117K | 396 |
| Del Taco | 37 | $50K | 166 |
| Chicken Express | 34 | $101K | 714 |
| Pizza Inn | 34 | $91K | 522 |
| TGI Fridays | 34 | $123K | 731 |
| El Pollo Loco | 33 | $162K | 196 |
| Bojangles | 32 | $38K | 163 |
| Pizza Ranch | 32 | $12K | 176 |
| Qdoba | 32 | $39K | 306 |
| Shoney's | 32 | $82K | 389 |
| Carl's Jr. | 31 | $16K | 88 |
| Hooters | 31 | $126K | 968 |
| Panda Express | 31 | $3K | 28 |
| Red Lobster | 31 | $49K | 202 |
| Golden Chick | 29 | $113K | 339 |
| Whataburger | 29 | $89K | 2,195 |
| Ruby Tuesday | 28 | $17K | 116 |
| Starbucks | 28 | $6K | 32 |
| Bob Evans | 27 | $5K | 38 |
| Wienerschnitzel | 27 | $43K | 100 |
| Cracker Barrel | 25 | $7K | 14 |
| McAlister's Deli | 25 | $15K | 151 |
| Olive Garden | 25 | $29K | 200 |
| Captain D's | 21 | $33K | 138 |
| Taco Cabana | 13 | $3K | 3 |
| Krispy Kreme | 12 | $795K | 676 |
| Potbelly | 10 | $5K | 38 |
| In-N-Out Burger | 3 | $0 | 0 |
Fiscal years run from October 1 to September 30; cases are assigned to the fiscal year in which the findings period ended. Employees = employees with violations in the case file. Co-branded locations (for example KFC and Taco Bell) count for each brand.
Which Restaurant Chains Owe the Most Back Wages
Back wages are the unpaid wages the employer agreed to pay after the investigation, not counting liquidated damages or civil money penalties.
Subway cases carried the most back wages ($7.8 million), followed by IHOP ($4.1 million) and Dunkin' ($3.0 million).
Back wage totals depend on the number of cases and on a few large ones. The median case with back wages was $1,246 at Subway restaurants and $3,593 at IHOP. Across all named chains, overtime accounted for 65.6% of the minimum wage and overtime back wages under the Fair Labor Standards Act, against 70.0% at other food service employers.
The CSV lists, for every brand, the overtime and minimum wage back wages, the civil money penalties assessed and the number of states with at least one case.
Back wages in Wage and Hour Division cases by restaurant brand, FY2005–FY2025
- Subway$7.8 million2,525 cases · median $1,246
- IHOP$4.1 million528 cases · median $3,593
- Dunkin'$3.0 million696 cases · median $1,656
- McDonald's$3.0 million1,304 cases · median $1,492
- Domino's$2.2 million367 cases · median $1,443
- Denny's$2.2 million347 cases · median $1,955
- Jimmy John's$1.9 million237 cases · median $2,794
- Popeyes$1.5 million340 cases · median $1,804
- Huddle House$1.3 million259 cases · median $2,473
- Wendy's$1.2 million325 cases · median $1,309
Show all brands
- Sonic Drive-In$1.2 million475 cases · median $1,849
- KFC$1.2 million436 cases · median $1,092
- Dairy Queen$1.0 million438 cases · median $975
- Taco Bell$1.0 million393 cases · median $1,089
- Burger King$977,591431 cases · median $1,314
- Five Guys$894,301107 cases · median $3,189
- Krispy Kreme$794,59112 cases · median $99,067
- Pizza Hut$776,083314 cases · median $1,417
- Papa John's$725,820205 cases · median $1,692
- Church's Chicken$678,605167 cases · median $1,878
- Arby's$609,402217 cases · median $948
- Applebee's$531,279120 cases · median $2,538
- Little Caesars$504,921265 cases · median $1,409
- Marco's Pizza$491,082133 cases · median $1,052
- Wingstop$480,018114 cases · median $2,929
- Jack in the Box$424,371128 cases · median $3,422
- Golden Corral$416,826140 cases · median $2,805
- Checkers/Rally's$262,86098 cases · median $2,211
- Quiznos$245,803181 cases · median $1,278
- Moe's Southwest Grill$243,75486 cases · median $2,563
- Cici's Pizza$239,52174 cases · median $830
- Tropical Smoothie Cafe$238,13373 cases · median $1,761
- Baskin-Robbins$225,43997 cases · median $1,591
- Hardee's$218,84297 cases · median $1,004
- Texas Roadhouse$200,41050 cases · median $7,574
- Shipley Do-Nuts$188,17260 cases · median $4,638
- Blaze Pizza$187,15944 cases · median $603
- Dickey's Barbecue Pit$182,07763 cases · median $972
- Buffalo Wild Wings$181,22274 cases · median $1,364
- Jet's Pizza$172,50243 cases · median $2,307
- Zaxby's$163,55098 cases · median $923
- El Pollo Loco$161,67033 cases · median $8,704
- Chick-fil-A$136,899168 cases · median $922
- Hooters$125,59331 cases · median $2,714
- TGI Fridays$123,46634 cases · median $2,355
- Panera Bread$117,01238 cases · median $1,664
- Jersey Mike's$114,76993 cases · median $1,391
- Tim Hortons$114,62344 cases · median $1,133
- Perkins$113,62644 cases · median $2,789
- Golden Chick$112,50229 cases · median $4,093
- Waffle House$110,517174 cases · median $825
- Chicken Express$100,98534 cases · median $3,210
- Pizza Inn$91,26034 cases · median $1,290
- Whataburger$88,56929 cases · median $552
- Long John Silver's$86,37355 cases · median $1,952
- Shoney's$81,63632 cases · median $1,377
- Hungry Howie's$74,91459 cases · median $2,100
- Auntie Anne's$74,817110 cases · median $643
- Steak 'n Shake$71,29141 cases · median $742
- Chili's$58,36942 cases · median $526
- Outback Steakhouse$56,46862 cases · median $1,144
- Del Taco$50,32237 cases · median $2,658
- Red Lobster$49,00531 cases · median $602
- Taco John's$46,15543 cases · median $1,023
- Wienerschnitzel$42,63727 cases · median $1,879
- Cold Stone Creamery$39,57562 cases · median $453
- Firehouse Subs$39,51473 cases · median $788
- Qdoba$39,10932 cases · median $996
- Bojangles$38,39232 cases · median $1,079
- Culver's$34,80648 cases · median $572
- Captain D's$33,15521 cases · median $1,092
- Olive Garden$28,53925 cases · median $2,872
- Chipotle$20,21050 cases · median $251
- Ruby Tuesday$16,93028 cases · median $2,539
- Carl's Jr.$16,00731 cases · median $2,218
- McAlister's Deli$14,70725 cases · median $671
- Pizza Ranch$11,66032 cases · median $773
- Cracker Barrel$7,17925 cases · median $3,590
- Sbarro$7,12747 cases · median $1,443
- Starbucks$5,93028 cases · median $1,121
- Potbelly$5,15410 cases · median $687
- Bob Evans$4,51127 cases · median $142
- Taco Cabana$3,32913 cases · median $34
- Panda Express$3,21731 cases · median $196
- Chuck E. Cheese$16556 cases · median $165
- In-N-Out Burger$03 cases · median $0
Median = median back wages among the brand's cases in which back wages were found due.
How Many Restaurant Wage Cases Involve Chains Each Year
The yearly series counts all food service cases and the share at the named chains by the fiscal year in which the findings period ended.
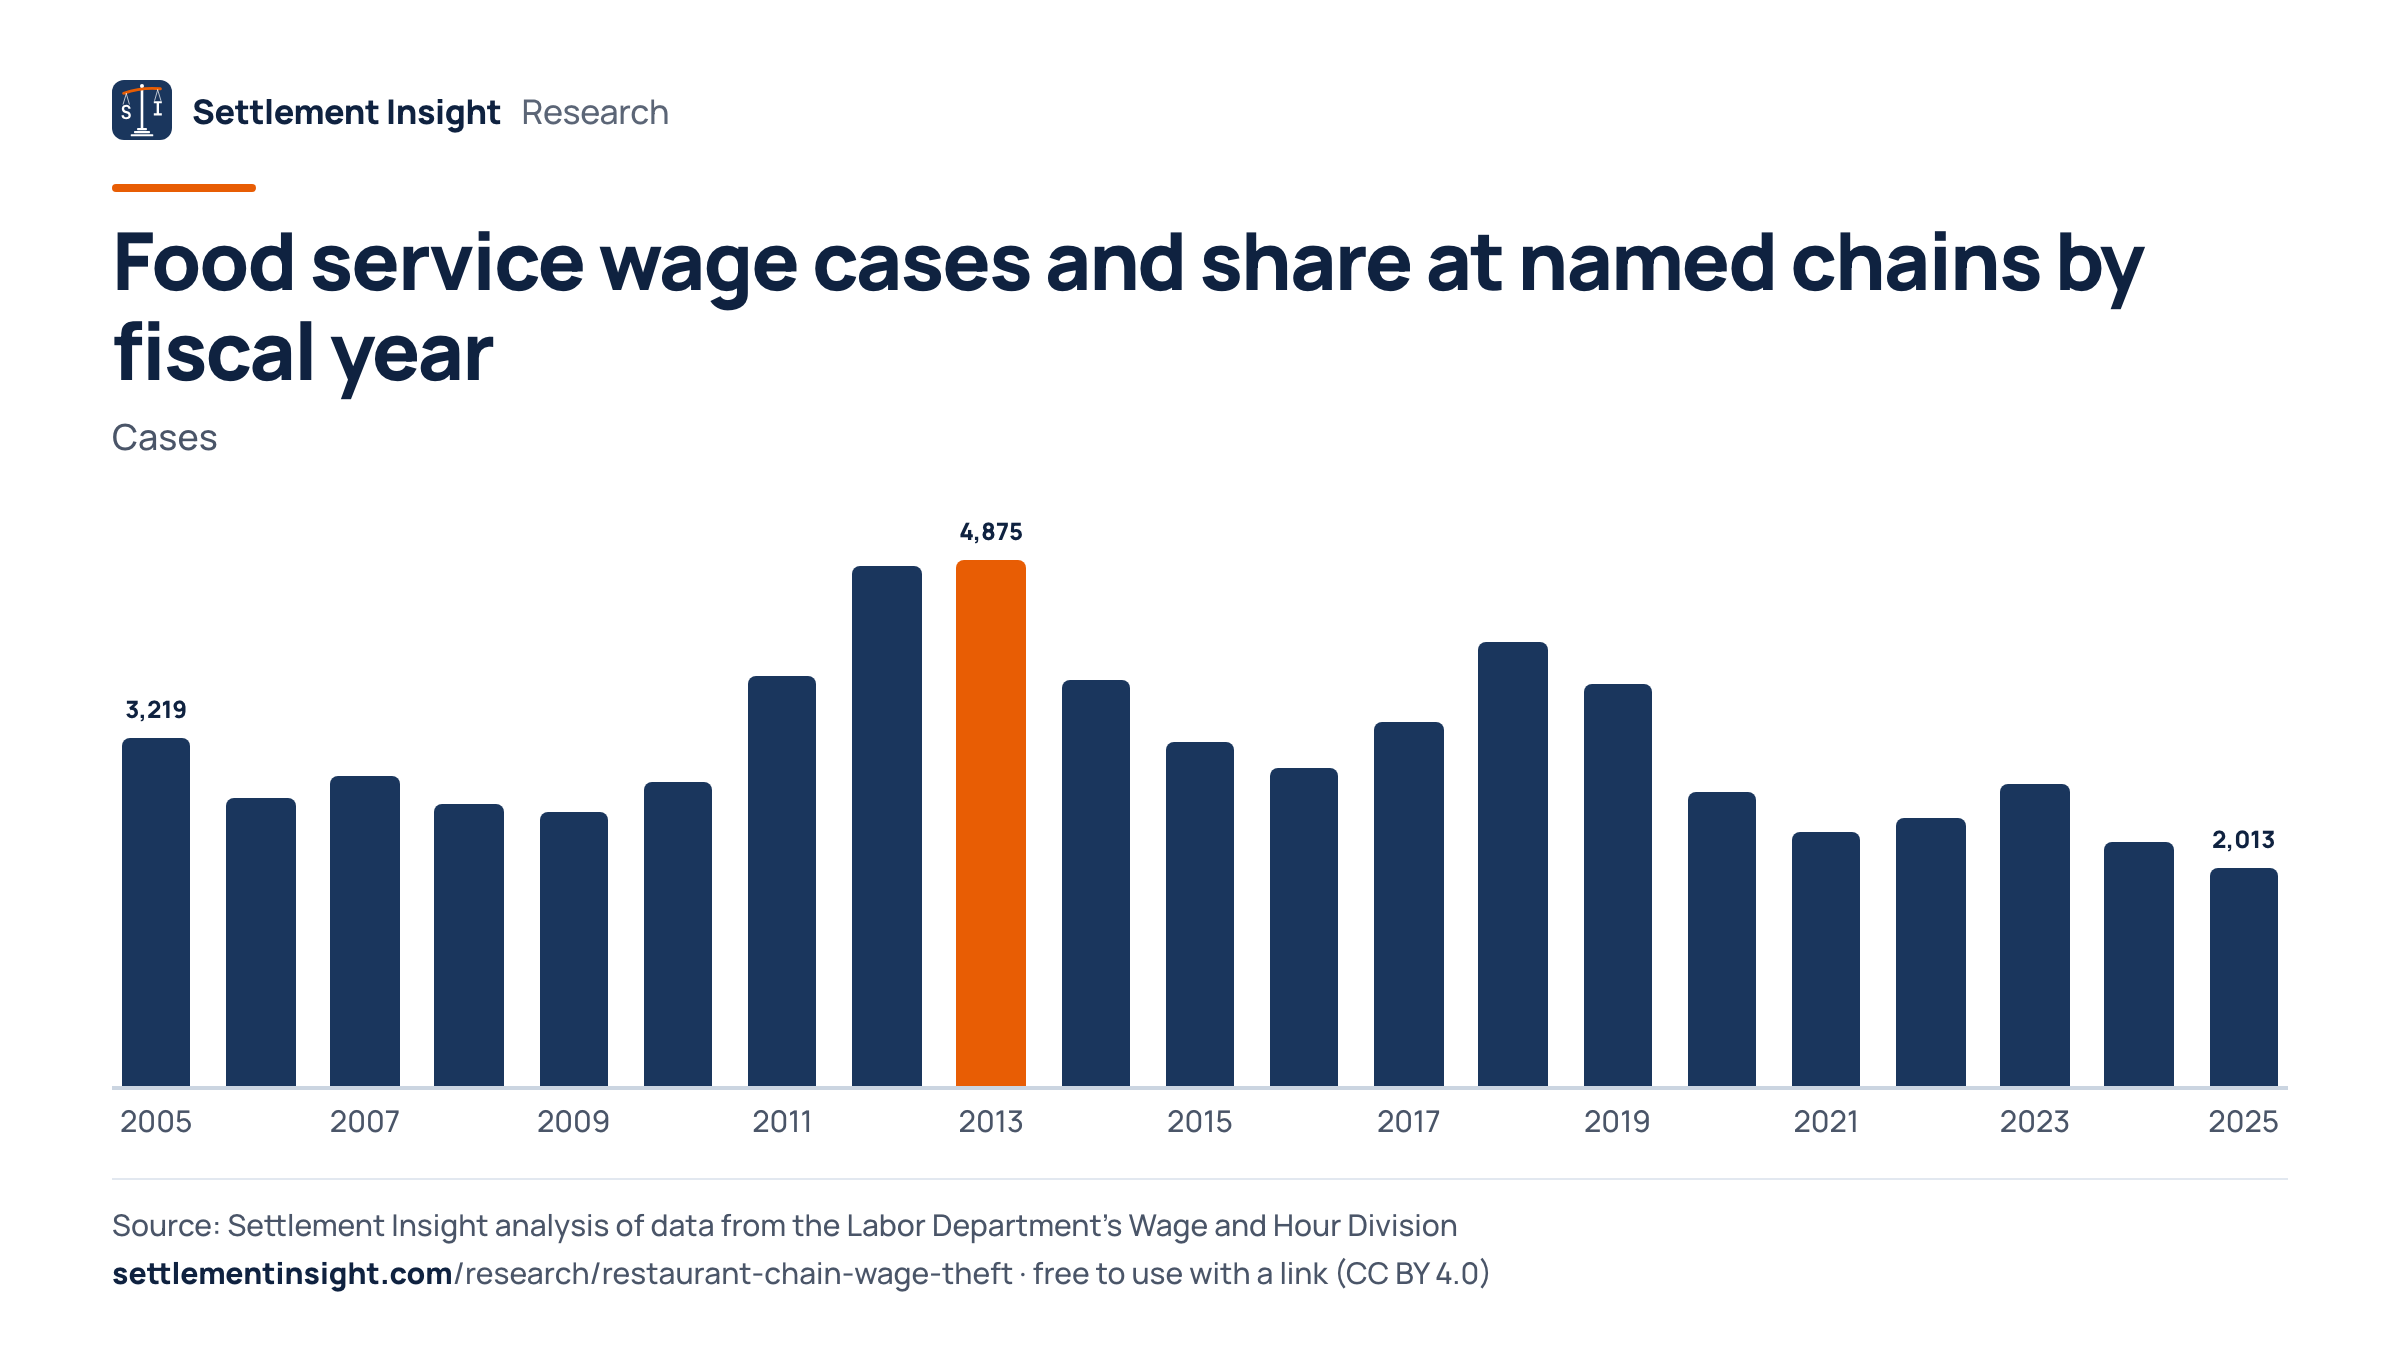
In fiscal 2023, the last year we treat as complete, the case file holds 2,803 food service cases, 22.3% of them at named chains. The highest count in our series was fiscal 2013 with 4,875.
Cases enter the public file only after they are concluded, and investigations can take months or years. Fiscal 2024 and 2025 are therefore still filling up and are marked as such; their lower counts are not a decline in enforcement.
The WHD's own yearly table counts food service compliance actions by the year a case was concluded and lists more cases than the public file holds: in all 11 complete comparison years from fiscal 2013 to 2023 the table counts 54,366 actions, against 36,324 cases in the file by findings year. For fiscal 2024, which is still being added to the file, the table reports 3,827 actions and the file so far holds 2,259; part of that gap will close as late cases arrive. The methodology explains the gap.
Food service wage cases and share at named chains by fiscal year
| FY | Cases | Chain share | Status |
|---|---|---|---|
| 2025 | 2,013 | 13.6% | still being added |
| 2024 | 2,259 | 17.6% | still being added |
| 2023 | 2,803 | 22.3% | complete |
| 2022 | 2,478 | 21.8% | complete |
| 2021 | 2,356 | 24.5% | complete |
| 2020 | 2,712 | 15.0% | complete |
| 2019 | 3,723 | 16.9% | complete |
| 2018 | 4,110 | 18.7% | complete |
| 2017 | 3,374 | 19.1% | complete |
| 2016 | 2,940 | 20.3% | complete |
| 2015 | 3,187 | 19.4% | complete |
| 2014 | 3,766 | 19.9% | complete |
All fiscal years since 2005
| FY | Cases | Chain share | Status |
|---|---|---|---|
| 2013 | 4,875 | 22.0% | complete |
| 2012 | 4,817 | 22.1% | complete |
| 2011 | 3,792 | 26.7% | complete |
| 2010 | 2,809 | 26.4% | complete |
| 2009 | 2,534 | 23.6% | complete |
| 2008 | 2,607 | 23.5% | complete |
| 2007 | 2,876 | 24.9% | complete |
| 2006 | 2,673 | 24.8% | complete |
| 2005 | 3,219 | 23.7% | complete |
FY = fiscal year in which the findings period ended (October 1 to September 30). Chain share = cases at the named chains as a share of all food service cases.
Download the Data and Cite This Study
Every table as a CSV file and in one Excel workbook, a short PDF summary and every chart as an image, free to reuse with attribution (CC BY 4.0).
- Food service wage cases and the share at named restaurant chains by fiscal yearWage and Hour Division food service cases per fiscal year of the end of the findings period, cases at the named chains, their share, and Subway and McDonald's cases; FY2024 and FY2025 are still being added. · 21 rows · CSV, 1 KB
- U.S. Labor Department wage cases by restaurant brand, FY2005-FY2025Concluded Wage and Hour Division cases in food services (NAICS 722) whose findings period ended in FY2005-FY2025, grouped by the restaurant brand in the trade name, with back wages, employees with violations, overtime and minimum-wage back wages and civil money penalties. · 86 rows · CSV, 9 KB
- Wage cases at the ten restaurant brands with the most cases, by fiscal yearCases and back wages per fiscal year for the ten brands with the most Wage and Hour Division food service cases, FY2005-FY2025. · 210 rows · CSV, 7 KB
- All tables in one Excel workbookOne sheet per table plus an About sheet with sources, method and citation · Excel (.xlsx), 28 KB
Charts for your story
Wage and Hour Division cases by restaurant brand, FY2005–FY2025
Embed this chart
Back wages in Wage and Hour Division cases by restaurant brand, FY2005–FY2025
Embed this chart
Food service wage cases and share at named chains by fiscal year
Embed this chart
How to cite
Goldberg, L. (2026). Restaurant Chain Wage Theft — U.S. Labor Department Wage Cases by Restaurant Brand (FY2005–FY2025) [Data set]. Settlement Insight. https://settlementinsight.com/research/restaurant-chain-wage-theft
BibTeX
@dataset{goldberg_2026_restaurant_chain_wage_theft,
  author    = {Goldberg, Leonard},
  title     = {Restaurant Chain Wage Theft --- U.S. Labor Department Wage Cases by Restaurant Brand (FY2005--FY2025)},
  year      = {2026},
  publisher = {Settlement Insight},
  url       = {https://settlementinsight.com/research/restaurant-chain-wage-theft}
}How We Measured
Checked against published figures
- Back wages (excluding liquidated damages) in the WHD case against the operator of 14 Subway restaurants in the San Francisco Bay Area, case file vs. DOL news release: published $475,000, our count $475,000 (exact match).Federal court orders Bay Area Subway owners to pay nearly $1 million in back wages, damages and sell or shut down their businesses (U.S. Department of Labor news release, Sept. 29, 2023)
- Employees owed back wages in the same Subway case (case file: employees with violations): published 184, our count 186 (1.09% apart).Federal court orders Bay Area Subway owners to pay nearly $1 million in back wages, damages and sell or shut down their businesses (U.S. Department of Labor news release, Sept. 29, 2023)
- Overtime back wages in the WHD case against the operator of seven McDonald's restaurants in Yuma, Arizona, case file vs. DOL news release: published $62,238, our count $62,238 (exact match).US Department of Labor recovers $128K in back wages, damages after investigation finds McDonald's franchisee shortchanged workers in Yuma (U.S. Department of Labor news release, June 1, 2022)
- Workers owed wages in the same McDonald's case (case file: employees with violations): published 332, our count 332 (exact match).US Department of Labor recovers $128K in back wages, damages after investigation finds McDonald's franchisee shortchanged workers in Yuma (U.S. Department of Labor news release, June 1, 2022)
- Minimum-wage back wages in the same McDonald's case, case file vs. DOL news release: published $2,160, our count $2,160 (exact match).US Department of Labor recovers $128K in back wages, damages after investigation finds McDonald's franchisee shortchanged workers in Yuma (U.S. Department of Labor news release, June 1, 2022)
Full method and limits of the data
We kept all cases with an industry code in NAICS 722 (food services and drinking places: full-service restaurants, limited-service eating places, special food services and drinking places) whose findings period ended between October 1, 2004 and September 30, 2025: 65,923 cases. The file has no conclusion date, so cases are assigned to the federal fiscal year in which the findings period ended.
To identify chains, we lower-cased each trade name (the trade_name field), removed every character other than letters and digits and matched the result against exactly 86 restaurant brands; a brand counts when one of its match strings appears anywhere in the normalized name (or, where stated, at its start), which catches store numbers and "dba" names. The complete list, with match strings: Subway ("subway"); McDonald's ("mcdonald"); Dunkin' ("dunkin"); Burger King ("burgerking"); Dairy Queen ("dairyqueen"); Taco Bell ("tacobell"); Pizza Hut ("pizzahut"); Wendy's ("wendys"); IHOP ("ihop" or "internationalhouseofpancake"); Domino's ("domino"); Arby's ("arbys"); Denny's ("dennys"); Huddle House ("huddlehouse"); KFC ("kfc" or "kentuckyfriedchicken"); Church's Chicken ("churchschicken" or "churchsfriedchicken" or starts with "churchs"); Jimmy John's ("jimmyjohn"); Chick-fil-A ("chickfila"); Sonic Drive-In ("sonicdrive" or starts with "sonic"); Golden Corral ("goldencorral"); Jack in the Box ("jackinthebox"); Waffle House ("wafflehouse"); Little Caesars ("littlecaesar" or "littleceasar"); Zaxby's ("zaxby"); Papa John's ("papajohn"); Marco's Pizza ("marcospizza"); Wingstop ("wingstop"); Popeyes ("popeye"); Quiznos ("quizno"); Moe's Southwest Grill ("moessouthwest"); Buffalo Wild Wings ("buffalowildwing"); Firehouse Subs ("firehousesub"); Hardee's ("hardees"); Tropical Smoothie Cafe ("tropicalsmoothie"); Applebee's ("applebee"); Baskin-Robbins ("baskinrob"); Cici's Pizza ("cicis"); Shipley Do-Nuts ("shipley"); Cold Stone Creamery ("coldstone"); Outback Steakhouse ("outback"); Texas Roadhouse ("texasroadhouse"); Checkers/Rally's (starts with "checkers" or "rallys"); Jersey Mike's ("jerseymike"); Auntie Anne's ("auntieanne"); Pizza Ranch ("pizzaranch"); Chipotle ("chipotle"); Panera Bread ("panera"); El Pollo Loco ("elpolloloco"); Panda Express ("pandaexpress"); Dickey's Barbecue Pit ("dickeys"); Jet's Pizza ("jetspizza"); Blaze Pizza ("blazepizza"); Pizza Inn ("pizzainn"); Golden Chick ("goldenchick"); Chicken Express ("chickenexpress"); Sbarro ("sbarro"); Starbucks ("starbucks"); Cracker Barrel ("crackerbarrel"); Olive Garden ("olivegarden"); Red Lobster ("redlobster"); Chili's ("chilis"); TGI Fridays ("tgifriday"); Ruby Tuesday ("rubytuesday"); Bojangles ("bojangle"); Whataburger ("whataburger"); Carl's Jr. ("carlsjr"); Steak 'n Shake ("steaknshake" or "steakandshake"); Long John Silver's ("longjohnsilver"); Krispy Kreme ("krispykreme"); Tim Hortons ("timhorton"); Potbelly ("potbelly"); Five Guys ("fiveguys"); In-N-Out Burger ("innoutburger"); Culver's ("culvers"); Bob Evans ("bobevans"); Perkins ("perkins"); Shoney's ("shoneys"); Hooters ("hooters"); Qdoba ("qdoba"); Taco Cabana ("tacocabana"); Del Taco ("deltaco"); Captain D's ("captainds"); Chuck E. Cheese ("chuckecheese"); Taco John's ("tacojohns"); Wienerschnitzel ("wienerschnitzel"); McAlister's Deli ("mcalisters"); Hungry Howie's ("hungryhowie"). No other brands or spelling variants are counted; chains not on this list (for example Johnny Rockets or Smoothie King, each with fewer than thirty cases) count as non-chain cases. We checked every trade name that appears ten or more times in food services; no brand outside our list comes close to the twenty-five brands with the most cases. Trade names that carry two brands (114 cases) count for each brand; the chain totals (14,066 cases) count each case once. Chain shares divide by all 65,923 food service cases; the back-wage share divides the bw_amt total of chain cases by the bw_amt total of all 65,923 cases ($614.8 million); civil money penalties are not included. State counts per brand count only the fifty states by the case's state field; the District of Columbia, Puerto Rico, Guam and the Northern Mariana Islands are not counted as states.
Calibration: the public file can be checked case by case against the department's news releases. For the case against the operator of fourteen Subway restaurants in the San Francisco Bay Area, the file lists $475,000 in back wages, the amount in the department's release; for a McDonald's franchise operator in Yuma, Arizona, it lists $62,238 in overtime back wages and 332 employees, both matching the release. The WHD's yearly table of low-wage industries counts by conclusion year and cannot be reproduced from the file: in all 11 fiscal years from 2013 to 2023 the file holds fewer food service cases by findings year than the table counts by conclusion year, 36,324 against 54,366 in total (33.2% fewer). The department does not document the difference.
What this data cannot tell you
- A brand is not a company. The investigated employer is the legal entity named in the case, for example a franchise operator, and a case under a brand name does not mean the brand's parent company was a party. Trade names are entered by investigators; spellings that do not contain the brand name are not counted, and restaurants that investigators coded outside NAICS 722 are not included (for example Dunkin' locations coded as food stores or bakeries), so the brand counts are lower bounds.
- The ranking reflects size and enforcement choices, not compliance rates. The case file contains no location or employee counts, so brands with more U.S. restaurants have more opportunities to be investigated, and investigations are not a random sample: some are part of the division's ongoing enforcement initiative in the restaurant industry.
- Cases appear only after they are concluded. Findings periods ending in fiscal 2024 and 2025 are still being added as investigations close, so those years are incomplete and the cumulative totals will rise. Earlier years can also gain a few cases that close late.
- The data cover federal enforcement only. Cases brought by state labor departments, city agencies and private wage lawsuits are not included, and the public file lists fewer cases than the WHD's own yearly tables report.
Frequently Asked Questions
Which restaurant chain has the most wage theft cases?
Subway. The Labor Department's Wage and Hour Division concluded 2,525 cases at restaurants under the Subway brand with findings periods ending in fiscal 2005–2025, more than any other restaurant brand. McDonald's followed with 1,304 and Dunkin' with 696.
How many wage violation cases does McDonald's have?
The federal case file lists 1,304 Wage and Hour Division cases at McDonald's restaurants with findings ending in fiscal 2005–2025, with $3.0 million in back wages. Back wages were found due in 40.8% of those cases.
How much back pay have Subway workers recovered?
Cases at Subway restaurants carried $7.8 million in back wages over fiscal 2005–2025, the most of any restaurant brand. The median case with back wages was $1,246.
Are franchise owners or the parent company responsible for wage violations?
The case file names the employer that was investigated, which for franchised restaurants can be the local franchise operator rather than the brand's parent company. Our brand count shows where cases occurred under each brand name; it does not show whether the parent company was a party to any case.
How common is wage theft in restaurants?
The Wage and Hour Division concluded 65,923 food service cases with findings ending in fiscal 2005–2025 and found back wages due in 60.8% of them, totaling $614.8 million. Investigations are not a random sample of restaurants, so this share is not a violation rate for the industry.
Do chain restaurants have more wage violations than independent restaurants?
The 86 named chains account for 21.3% of food service cases. When back wages were found due, the median chain case was $1,501, against $4,756 at other food service employers; the data do not show how many restaurants of each type exist.
Sources
- Wage and Hour Division Compliance Action Data — U.S. Department of Labor, Wage and Hour Division
- Low Wage, High Violation Industries — U.S. Department of Labor, Wage and Hour Division
- Federal court orders Bay Area Subway owners to pay nearly $1 million in back wages, damages and sell or shut down their businesses — U.S. Department of Labor
- US Department of Labor recovers $128K in back wages, damages after investigation finds McDonald's franchisee shortchanged workers in Yuma — U.S. Department of Labor
- Industries at a Glance: Food Services and Drinking Places, NAICS 722 — U.S. Bureau of Labor Statistics
- Department of Labor recovers $109K in back wages, damages from employers who denied full wages to 359 workers at 5 New Orleans restaurants — U.S. Department of Labor
- Independent analysis. Settlement Insight is not a law firm and not affiliated with any agency named here. Analysis by Leonard Goldberg, Editor. How we work: methodology, our data.
More Research and Data
Other studies from our database of public legal records — each with free CSV downloads.
Related research
Latest studies
- Bank complaints closed with moneyBank of America, N.A. closed 36.0% of 2025 checking/savings complaints with money, top of firms with 500+
- Dental Data Breaches276 dental breach reports to HHS, 45.7 million individuals affected (sum of reports)
- Mental Health Data BreachesAt least 210 HHS breach reports from mental health and addiction providers, 10.3 million affected (summed)
- Disputed NY Workers' Comp InjuriesNY workers' comp: 47% of hearing-loss claims disputed, 4% of contusions (2022–2024)