Original Research · Settlement Insight Research
An Age-Discrimination Charge Is Worth About $5,793
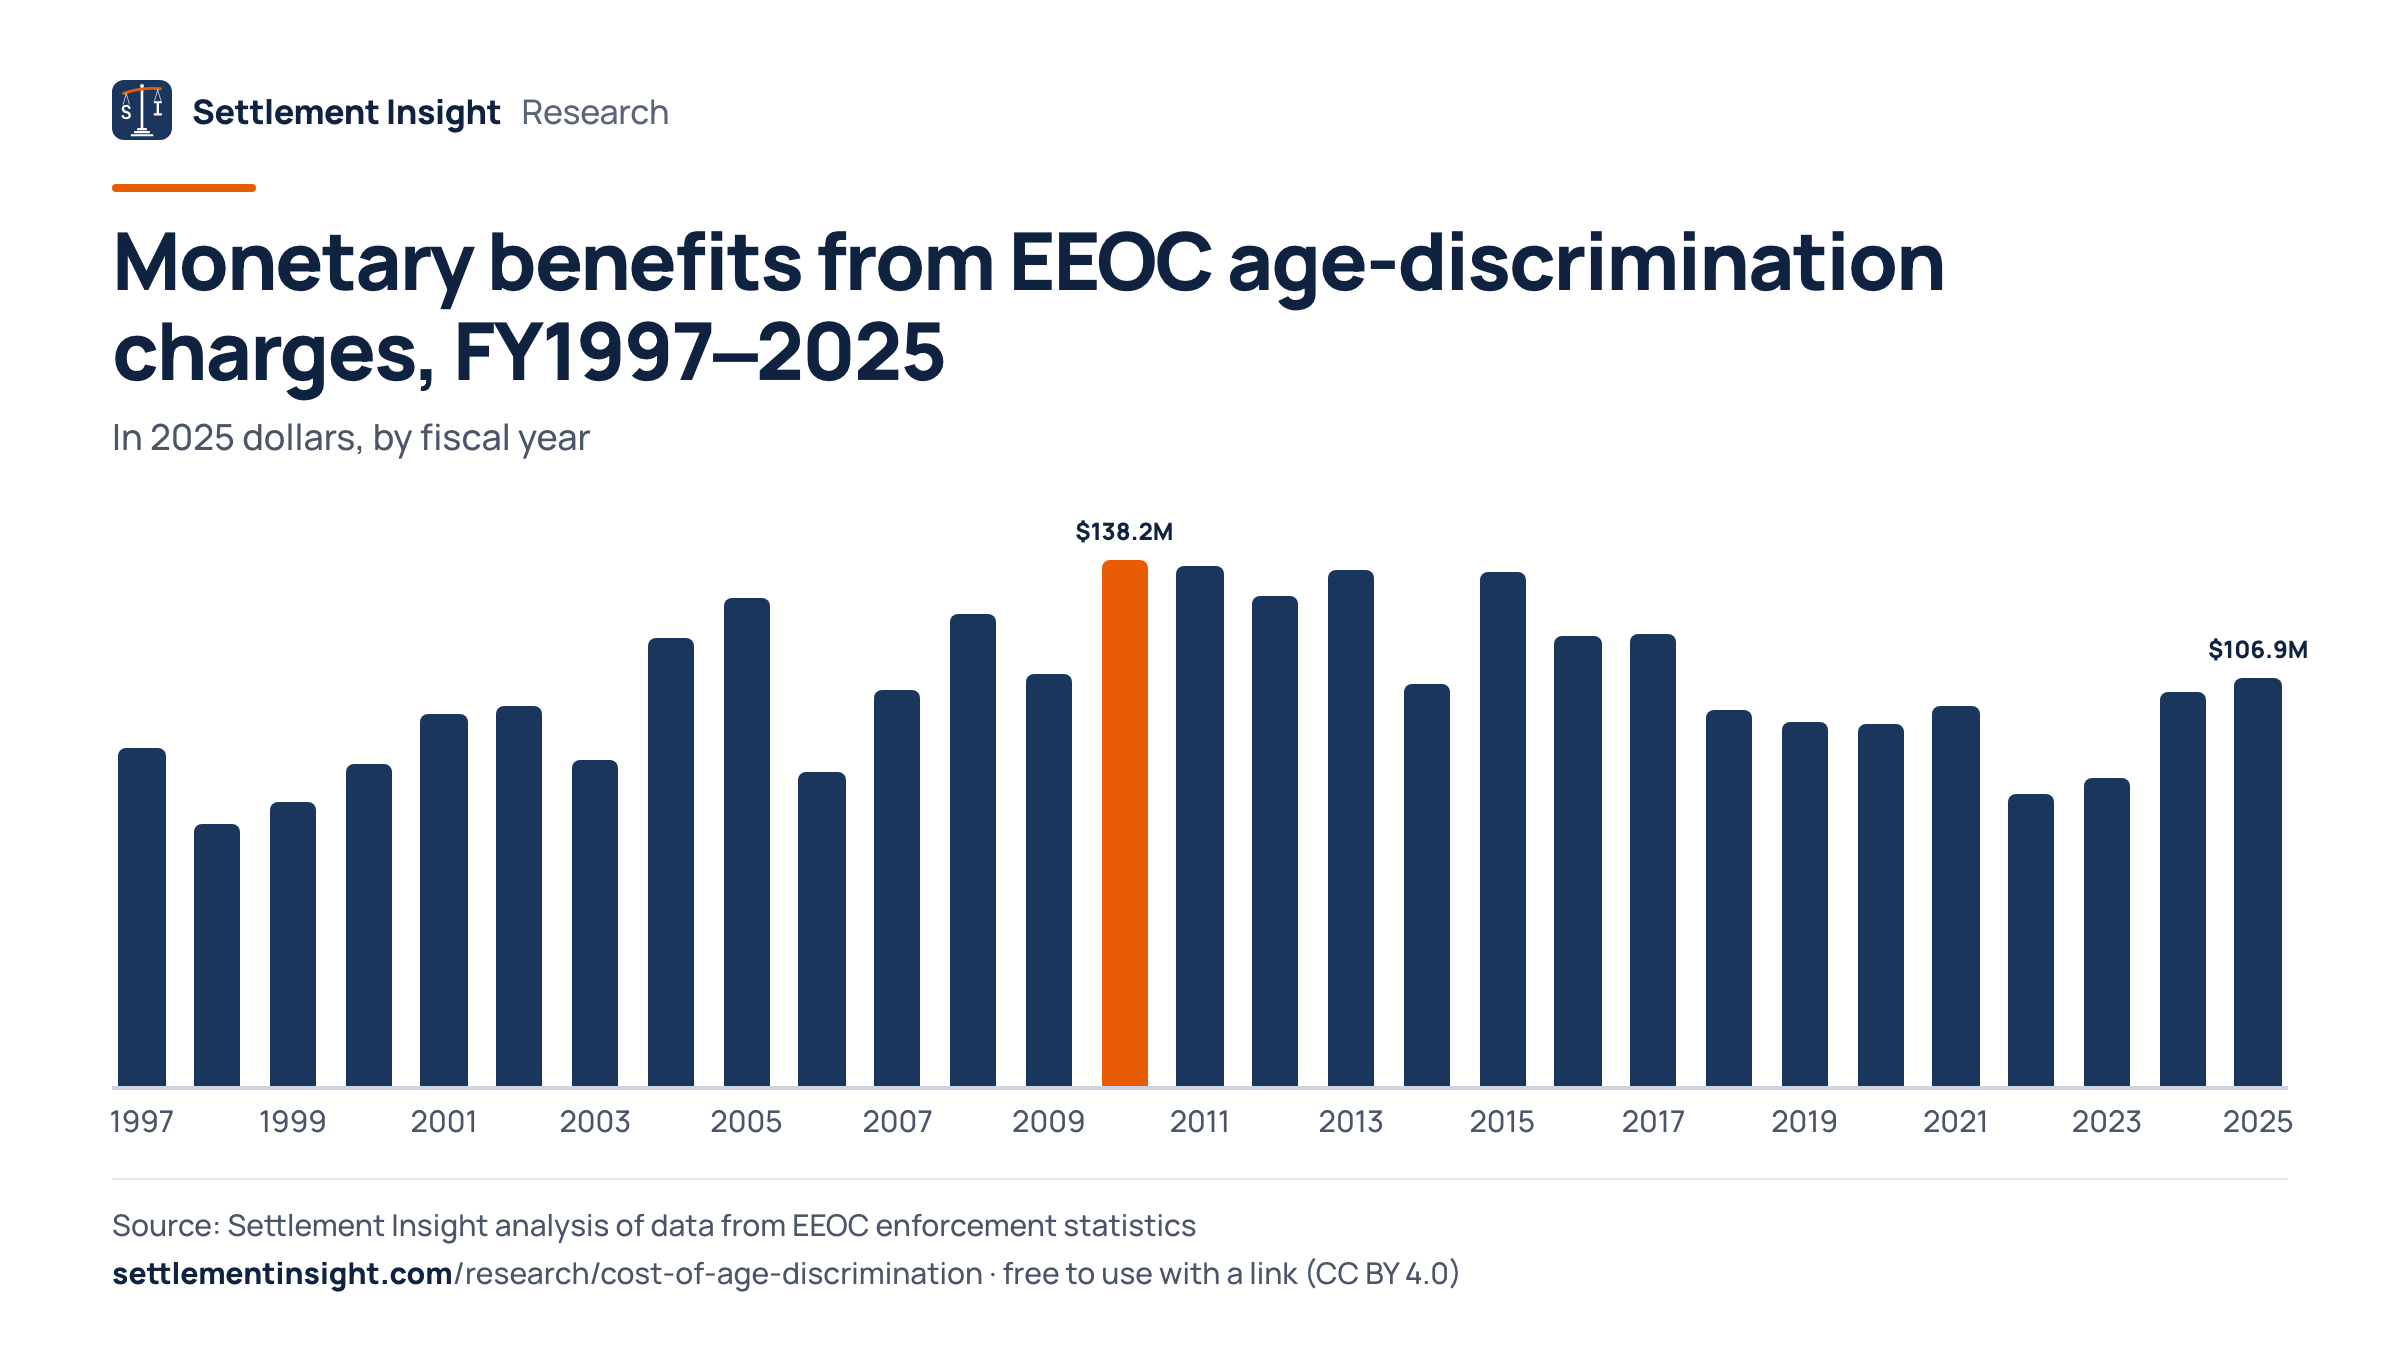
Between FY 1997 and FY 2025, 523,817 age-discrimination charges were filed with the U.S. Equal Employment Opportunity Commission. The agency recovered $3.03 billion through its administrative process, in 2025 dollars. Divided by the charges filed, that is $5,793 each — an average across all of them, most of which yield nothing at all. After inflation the figure has moved 16.1% in 28 years.
Published September 4, 2026 · Updated October 15, 2026 · Sources: EEOC Table E5a, BLS CPI-U, and our own corpus of announced resolutions
523,817
Charges filed
FY 1997–2025, age discrimination only
$5,793
Recovered per charge
$3.03 billion in 2025 dollars spread over every charge filed — most single charges yield nothing
+16.1%
Real change since FY 1997
$5,629 then, $6,536 now — inflation removed
12.2 → 6
Announced cases per year
2009–2014 against 2015–2025: the cases that get a press release have halved
Two channels, two very different numbers
Age discrimination is recovered through two separate routes, and they are almost never reported together. The first is administrative: a worker files a charge, the agency investigates, and most cases end without money. The EEOC publishes what this channel produces every fiscal year, and its own footnote states plainly that these figures exclude money obtained through litigation.
The second is the channel that produces press releases and headlines. We collected every monetary age resolution we could identify in the EEOC newsroom archive — 164 of them, $408.0 million in total, median $177,500. Cases are found by keyword in the headline, which is why 4 fiscal years in the table below show none. The two channels also overlap a little: 22 of these are conciliations, an administrative outcome, so that money sits in both figures.
The announced total is misleading on its own. A single 2003 consent decree carries 61.3% of it — the case in which more than 1,700 disabled California public-safety retirees had their disability pensions restored after the state had cut them in proportion to each officer’s age at hire. The EEOC put the benefits at $250 million, most of it to be paid out over the retirees’ lifetimes rather than at once. The five largest cases together carry 80.3%. Remove them and the median announced case is $150,000. These amounts are nominal, spanning three decades; only the administrative series above is inflation-adjusted.
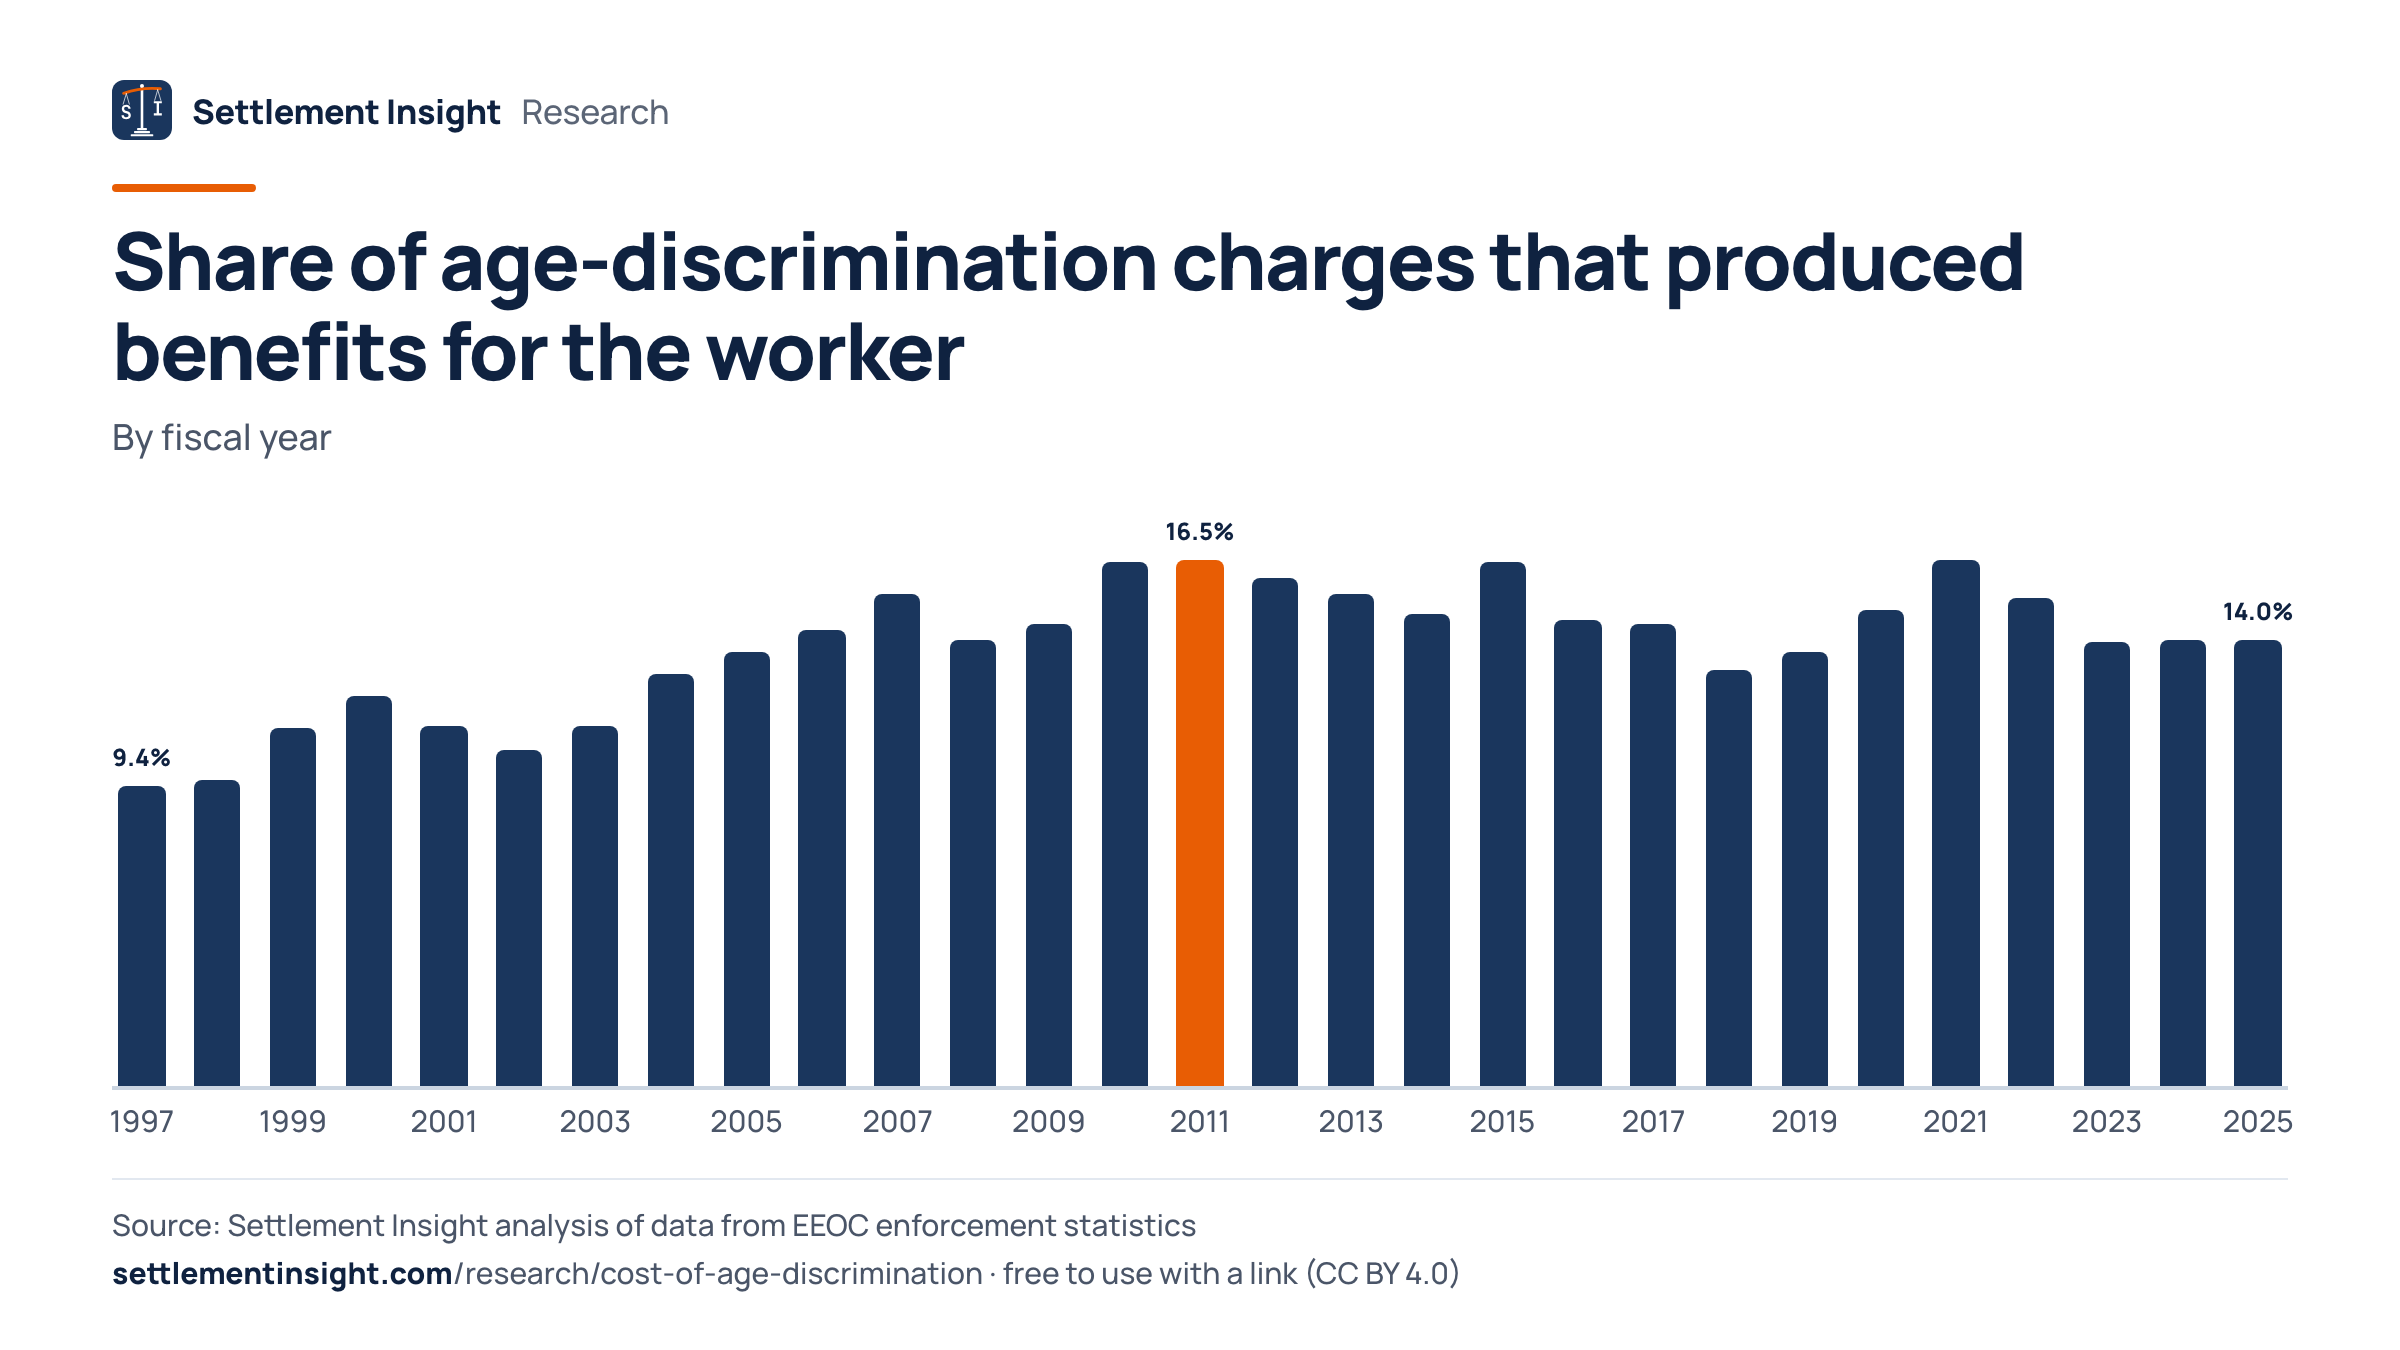
Two movements sit inside the administrative figure. In FY 2025 the EEOC closed 2,291 age charges with a settlement, a withdrawal with benefits or a successful conciliation — 14.0% of the charges filed that year, against 9.4% in FY 1997. That share rose by half. The money per such resolution, after a FY 1997 high of $60,116, has moved between that and $32,807 (FY 2009) in 2025 dollars without a trend — $46,656 in FY 2025. The 16.1% per charge is the net of the two.
Put next to each other, the two channels answer the question people usually ask wrong. The typical outcome is not a headline settlement. In FY 2025 there were 16,353 charges and 6 announced resolutions: roughly one public case per 2,726 charges filed.
Every fiscal year, FY 1997 to FY 2025
Monetary benefits are the EEOC’s administrative recoveries. Real dollars use CPI-U annual averages rebased to 2025. “With benefits” counts the EEOC’s settlements, withdrawals with benefits and successful conciliations. Only the last column is ours: the number of monetary age resolutions the agency announced publicly in that calendar year. Calendar years sit next to fiscal years here, so around a year’s turn a case can land one row off.
| Fiscal year | Charges | With benefits | Benefits (2025 $) | Per charge | Per case w/ benefits | Announced |
|---|---|---|---|---|---|---|
| FY 1997 | 15,785 | 1,478 | $88.9 million | $5,629 | $60,116 | — |
| FY 1998 | 15,191 | 1,454 | $68.5 million | $4,511 | $47,134 | — |
| FY 1999 | 14,141 | 1,578 | $74.6 million | $5,276 | $47,277 | 2 |
| FY 2000 | 16,008 | 1,957 | $84.5 million | $5,279 | $43,181 | — |
| FY 2001 | 17,405 | 1,966 | $97.6 million | $5,610 | $49,663 | 1 |
| FY 2002 | 19,921 | 2,101 | $99.7 million | $5,004 | $47,450 | 3 |
| FY 2003 | 19,124 | 2,161 | $85.6 million | $4,475 | $39,602 | 1 |
| FY 2004 | 17,837 | 2,303 | $117.6 million | $6,593 | $51,067 | 1 |
| FY 2005 | 16,585 | 2,259 | $128.1 million | $7,723 | $56,702 | 3 |
| FY 2006 | 16,548 | 2,361 | $82.2 million | $4,970 | $34,835 | 2 |
| FY 2007 | 19,103 | 2,939 | $103.7 million | $5,430 | $35,291 | 1 |
| FY 2008 | 24,582 | 3,446 | $123.8 million | $5,037 | $35,929 | 2 |
| FY 2009 | 22,778 | 3,298 | $108.2 million | $4,750 | $32,807 | 13 |
| FY 2010 | 23,264 | 3,824 | $138.2 million | $5,940 | $36,138 | 19 |
| FY 2011 | 23,465 | 3,873 | $136.3 million | $5,807 | $35,181 | 19 |
| FY 2012 | 22,857 | 3,624 | $128.4 million | $5,619 | $35,443 | 8 |
| FY 2013 | 21,396 | 3,298 | $135.3 million | $6,323 | $41,024 | 6 |
| FY 2014 | 20,588 | 3,050 | $105.7 million | $5,132 | $34,645 | 8 |
| FY 2015 | 20,144 | 3,303 | $134.6 million | $6,682 | $40,753 | 7 |
| FY 2016 | 20,857 | 3,036 | $118.3 million | $5,672 | $38,969 | 7 |
| FY 2017 | 18,376 | 2,671 | $118.3 million | $6,440 | $44,305 | 4 |
| FY 2018 | 16,911 | 2,193 | $98.7 million | $5,838 | $45,017 | 6 |
| FY 2019 | 15,573 | 2,113 | $95.3 million | $6,121 | $45,115 | 4 |
| FY 2020 | 14,183 | 2,116 | $94.9 million | $6,692 | $44,854 | 11 |
| FY 2021 | 12,965 | 2,141 | $99.6 million | $7,679 | $46,503 | 7 |
| FY 2022 | 11,500 | 1,765 | $76.3 million | $6,639 | $43,255 | — |
| FY 2023 | 14,144 | 1,970 | $80.9 million | $5,722 | $41,083 | 4 |
| FY 2024 | 16,233 | 2,269 | $103.6 million | $6,379 | $45,639 | 10 |
| FY 2025 | 16,353 | 2,291 | $106.9 million | $6,536 | $46,656 | 6 |
The largest announced resolutions
Every line links to the EEOC press release it came from, so any figure on this page can be checked at the source.
- $250.0 million2003-01-30DISABLED PUBLIC SAFETY OFFICERS TO RECEIVE BENEFITS IN HISTORIC EEOC SETTLEMENT FOR AGE DISCRIMINATION
- $28.0 million1999-07-29JOHNSON AND HIGGINS TO PAY $28 MILLION IN SETTLEMENT OF AGE DISCRIMINATION LAWSUIT
- $27.5 million2007-10-04$27.5 MILLION CONSENT DECREE RESOLVES EEOC AGE BIAS SUIT AGAINST SIDLEY AUSTIN
- $12.0 million2017-03-31Texas Roadhouse to Pay $12 Million to Settle EEOC Age Discrimination Lawsuit
- $10.0 million2020-06-11Jet Propulsion Laboratory to Pay $10 Million to Settle EEOC Age Discrimination Lawsuit
- $7.1 million1999-06-15EEOC SETTLES MAJOR AGE BIAS LAWSUIT FOR $7.1 MILLION WITH THOMSON CONSUMER ELECTRONICS AND LOCAL UNIONS
Method, and what these numbers cannot tell you
- EEOC monetary benefits in Table E5a are ADMINISTRATIVE only. The agency's own footnote: they do not include money obtained through litigation.
- 'Resolutions with benefits' are the EEOC's settlements, withdrawals with benefits and successful conciliations. Benefits can be non-monetary (a reinstatement, a policy change), so dollars per such resolution is a lower bound for the average paying case — not for any single one.
- Charge counts include charges filed concurrently under other statutes, so figures across bases sum to more than the agency's actual totals.
- Charges filed with state or local Fair Employment Practices Agencies are not included.
- The announced-resolution corpus covers cases the EEOC chose to publicise. Tens of thousands of charges are resolved each year without a press release and those skew far smaller.
- One 2003 consent decree carries most of the announced total, and its $250 million is the EEOC's estimate of benefits for more than 1,700 retirees, most of it to be paid out over their lifetimes rather than at once. Quoting the total without that fact describes one case as if it were the rule.
- The two channels are not perfectly separate: 22 of the announced resolutions are conciliations ($8,080,193, 2.0% of the announced total; see the resolution_type column of the case list). Conciliation is an administrative outcome, so that money is counted in both figures.
- Announced resolutions are identified by keyword in the press-release headline. That is why 4 fiscal years in the table show none (1997, 1998, 2000, 2022): the agency published no age case whose headline says so. Read the count as what we could identify, not as a census.
- Announced amounts are nominal and added up across 1994–2026; the administrative series next to them is inflation-adjusted. The two are not directly comparable in dollars.
- Announcements are dated by calendar year of the press release and shown next to fiscal years, which run October to September. Around the turn of a year a case can sit one row off.
- Real dollars use CPI-U annual averages rebased to the latest complete year; nominal figures are exported alongside so either can be checked.
- The CPI-U average for 2025 rests on 11 of 12 months; the Bureau of Labor Statistics never published the missing one. Since 2025 is the base year, this shifts every real figure here by well under a tenth of a percent.
The administrative series is EEOC Table E5a, downloaded from the agency’s enforcement statistics. Inflation adjustment uses BLS CPI-U annual averages, series CUUR0000SA0. The announced-resolution corpus is the age subset of our EEOC Discrimination Settlements dataset, which is archived under its own DOI. Its current archived version (2.0, October 2026) records exactly the figures used here for these 164 cases.
Questions we get asked
What does an age-discrimination charge actually yield?
Across FY 1997–2025 the EEOC recovered $3.03 billion in 2025 dollars through its administrative process, spread over 523,817 charges. That is roughly $5,793 per charge filed — and most charges yield nothing at all, because the money is concentrated in the minority that reach a merit resolution.
Has that number improved over time?
Barely. In FY 1997 a charge yielded $5,629 in 2025 dollars; in FY 2025 it yielded $6,536. That is 16.1% over 28 years. In nominal dollars the figure looks like it more than doubled, which is why the inflation adjustment matters.
What does a charge yield when it actually ends with something?
The EEOC counts three kinds of resolution that carry benefits: settlements, withdrawals with benefits and successful conciliations. In FY 2025 there were 2,291 of them against 16,353 charges, and the monetary benefits divided by that count come to $46,656. Across all 29 fiscal years that figure has stayed between $32,807 and $60,116 in 2025 dollars. Benefits can also be non-monetary — a reinstatement, a changed policy — so this is a floor for the average paying case, not for any single one.
Are fewer people complaining about age discrimination?
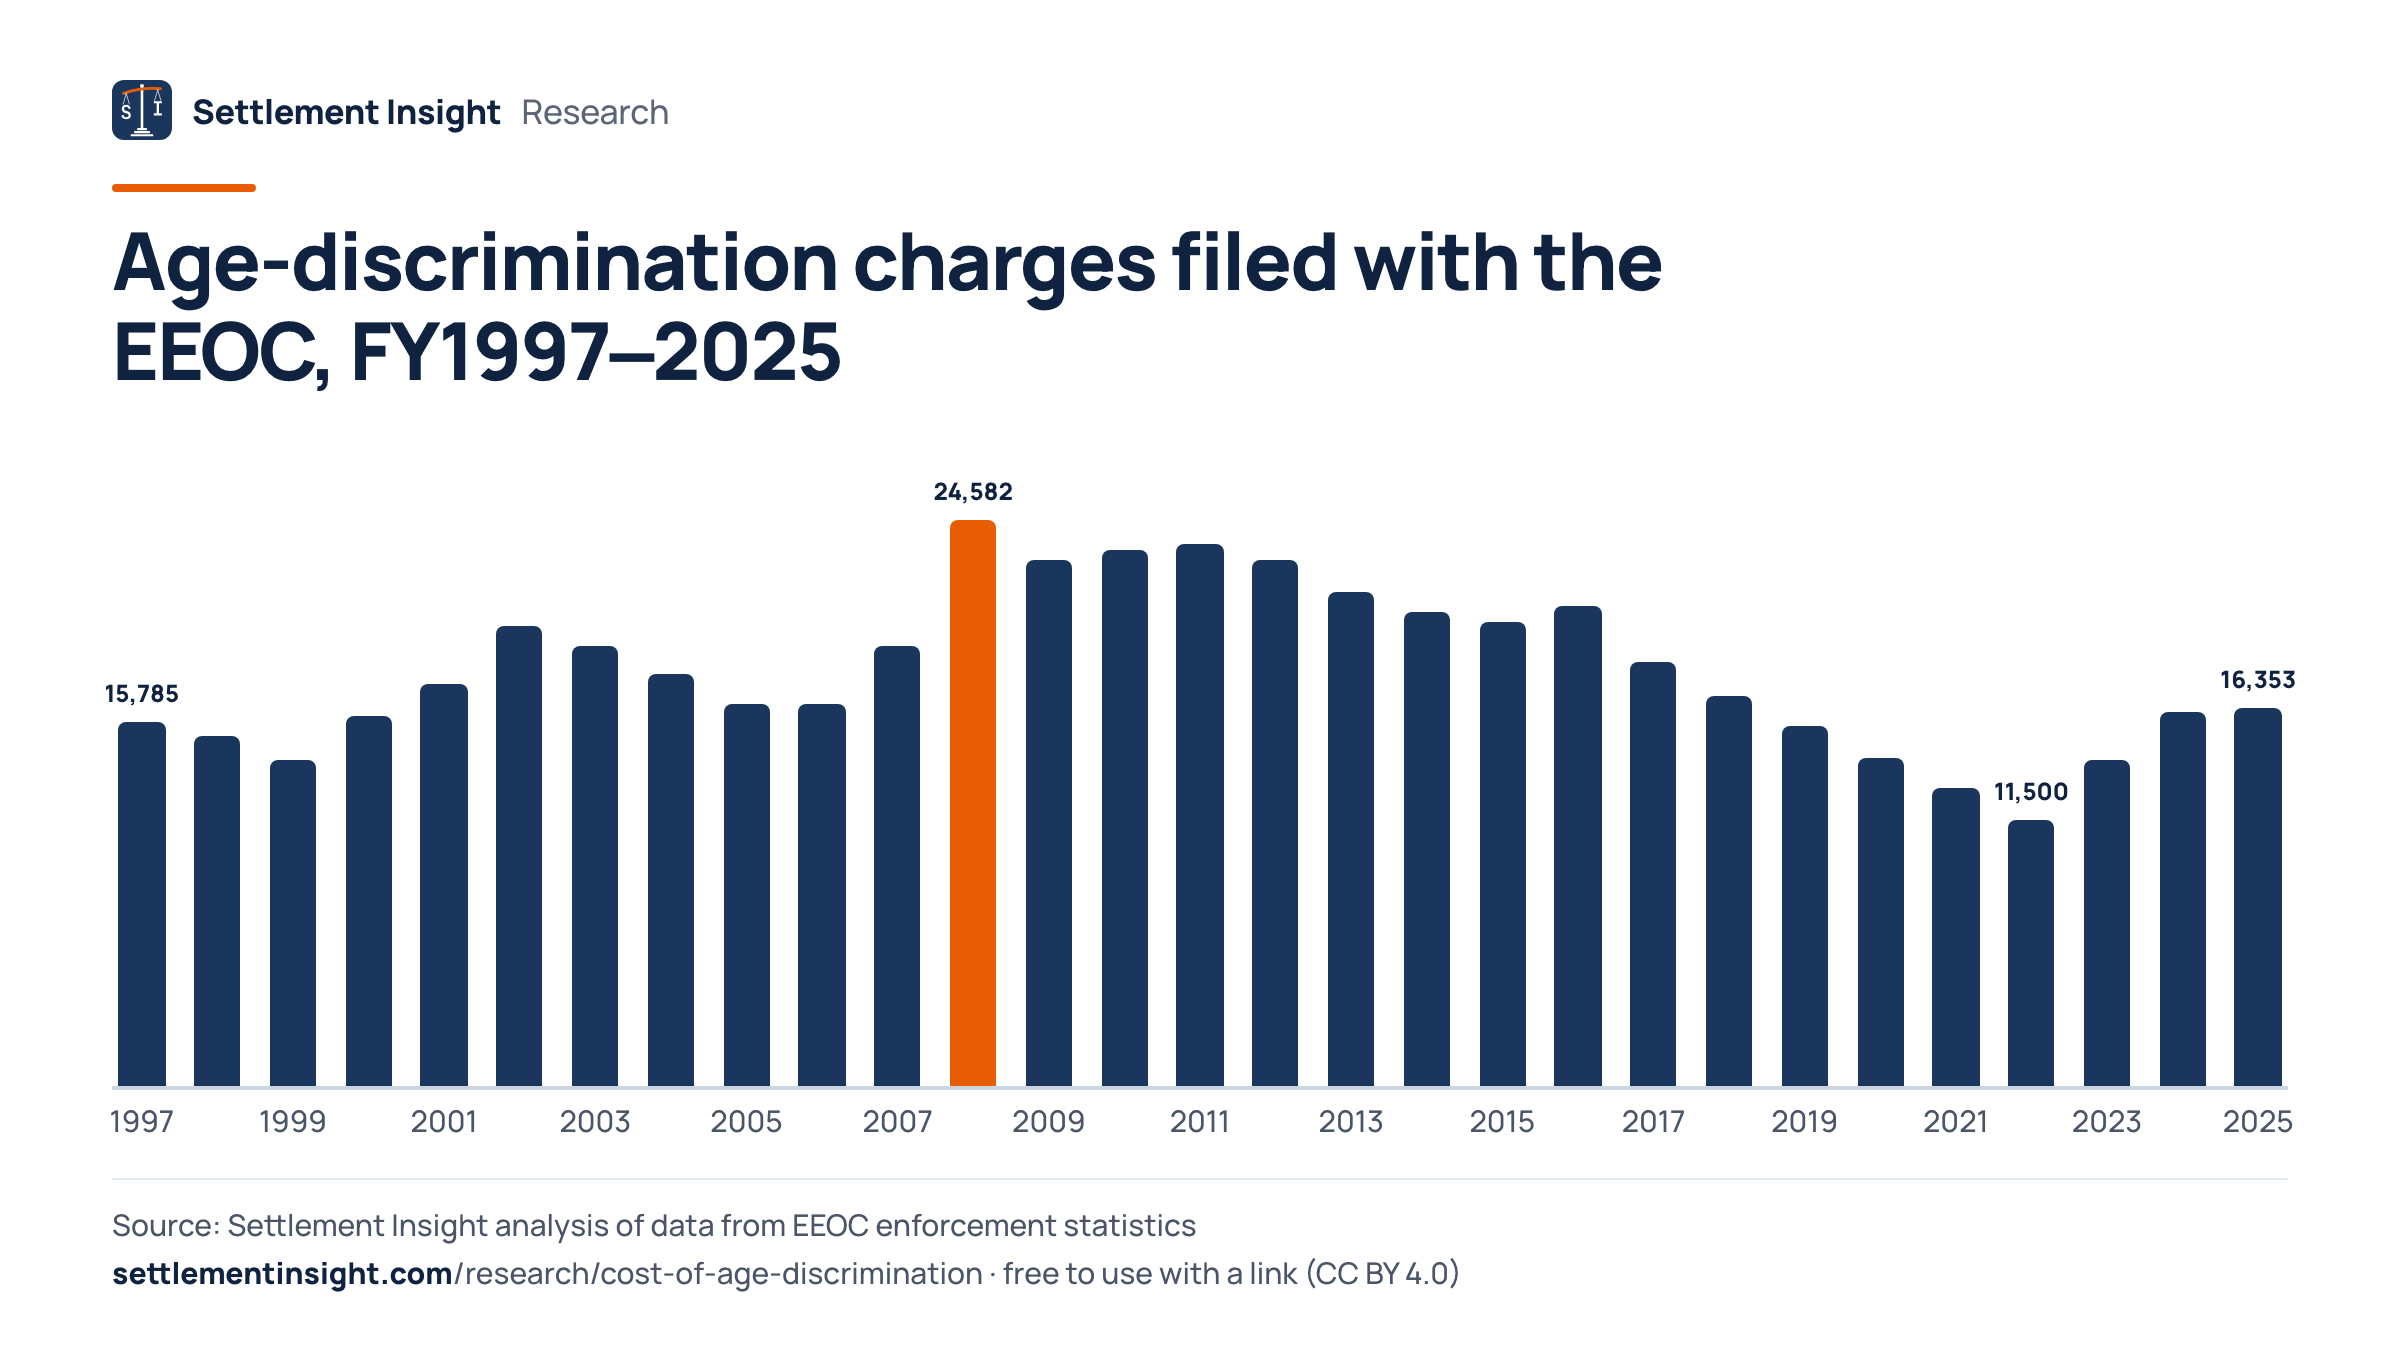
Charges peaked at 24,582 in FY 2008 and fell to 11,500 in FY 2022, then recovered to 16,353 in FY 2025 — close to where they stood in FY 1997 (15,785). What drove the rise and the long dip is not something this data can answer — it records how many charges were filed, not why.
How often does an age case become public?
Rarely, and less often than it used to. Between 2009 and 2014 the EEOC announced 12.2 monetary age resolutions per year; between 2015 and 2025 it announced 6. In FY 2025 there were 16,353 charges and 6 announced resolutions — about one press release per 2,726 charges.
Why not simply quote the total of the announced settlements?
Because it describes one case. The 164 announced monetary resolutions add up to $408.0 million, but a single 2003 consent decree — disability pensions restored to more than 1,700 California public-safety retirees, most of the $250 million to be paid out over their lifetimes rather than at once — carries 61.3% of that, and the five largest carry 80.3%. Strip those five out and the median announced case is $150,000. The announced figures are also nominal, unlike the inflation-adjusted administrative series.
Is this the full cost of ageism at work?
No, and nothing here should be read that way. This measures what the federal enforcement system recovered. It cannot see lost earnings for people who never filed, cases handled by state agencies, private suits brought without the EEOC, or the far larger group who simply stopped applying.
Cite this research
This analysis is released as an open, citable dataset. Researchers and journalists are welcome to use it with attribution.
Permanent identifier
10.7910/DVN/OPCLKDAPA
Goldberg, L. (2026). The Cost of Age Discrimination — 523,817 EEOC Charges and What They Yielded, FY 1997–2025 [Data set]. Harvard Dataverse. https://doi.org/10.7910/DVN/OPCLKD
BibTeX
@dataset{goldberg_2026_age,
  author    = {Goldberg, Leonard},
  title     = {The Cost of Age Discrimination --- 523,817 EEOC Charges
               and What They Yielded, FY 1997--2025},
  year      = {2026},
  publisher = {Harvard Dataverse},
  doi       = {10.7910/DVN/OPCLKD},
  url       = {https://doi.org/10.7910/DVN/OPCLKD}
}
Download the data
Aggregated CSV files — CC BY 4.0. Free to use with attribution.
- CSV
Year-by-year series
FY 1997–2025: charges filed, resolutions, resolutions with benefits, monetary benefits (nominal and 2025 dollars), dollars per charge and per resolution with benefits, and announced resolutions · 29 rows
- CSV
Announced resolutions, case level
Every publicly announced monetary age-discrimination resolution we could find, with resolution type and the EEOC source URL for each line · 164 rows
- XLSX
All tables in one Excel workbook
One sheet per table plus an About sheet with citation and license · 22 KB
- PDF
Summary to print or forward (2 pages)
Charts, data files and citation · 444 KB
Charts for your story
Free to publish with a link to this page (CC BY 4.0). Each chart carries its source line. PNG, 2400 × 1350 pixels.
Monetary benefits from EEOC age-discrimination charges, FY1997–2025
Download PNGEmbed this chart
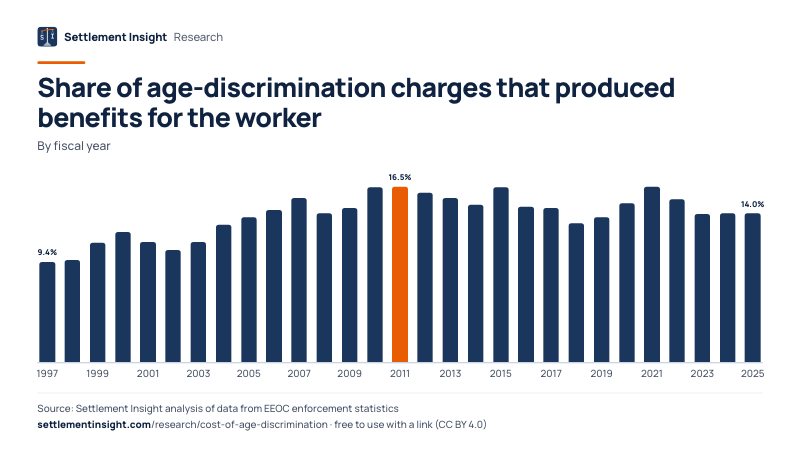
Share of age-discrimination charges that produced benefits for the worker
Download PNGEmbed this chart
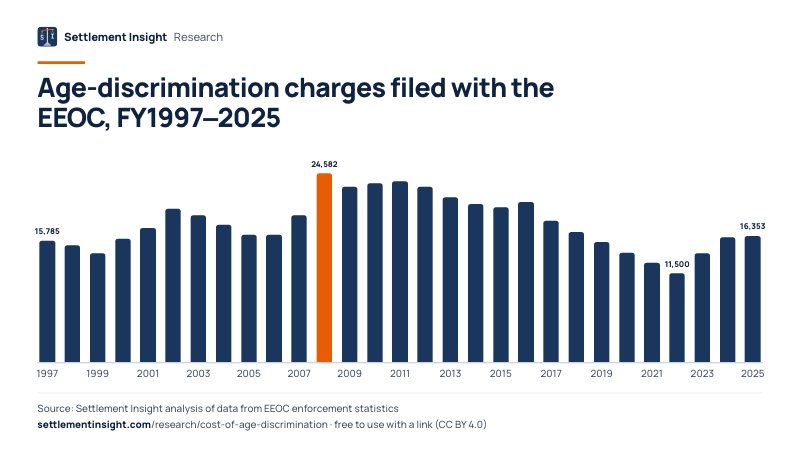
Age-discrimination charges filed with the EEOC, FY1997–2025
Download PNGEmbed this chart