Who Files the Most Federal Housing Discrimination Lawsuits
Original analysis of 8,884 records from the Federal Judicial Center, FY2016–FY2025 (federal fiscal years, Oct–Sep). Published October 20, 2026.
We counted every housing and accommodations civil rights case (nature of suit 443) commenced in U.S. district courts from FY2016 to FY2025 and grouped the FY2021–FY2025 cases by the first-listed plaintiff.
How concentrated federal housing discrimination cases are
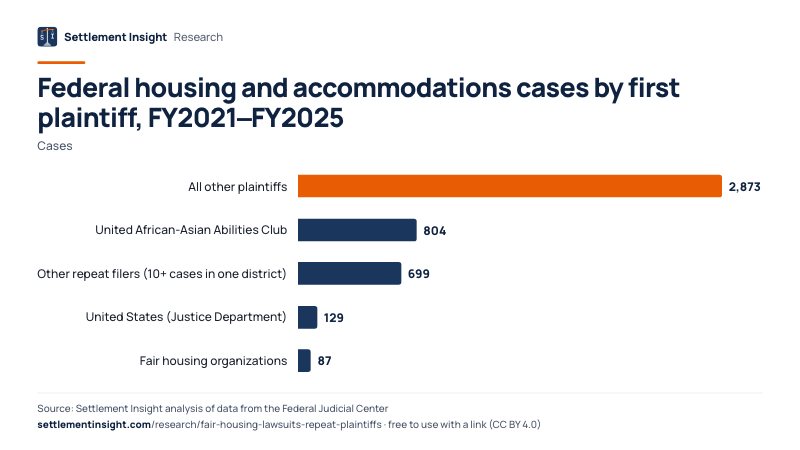
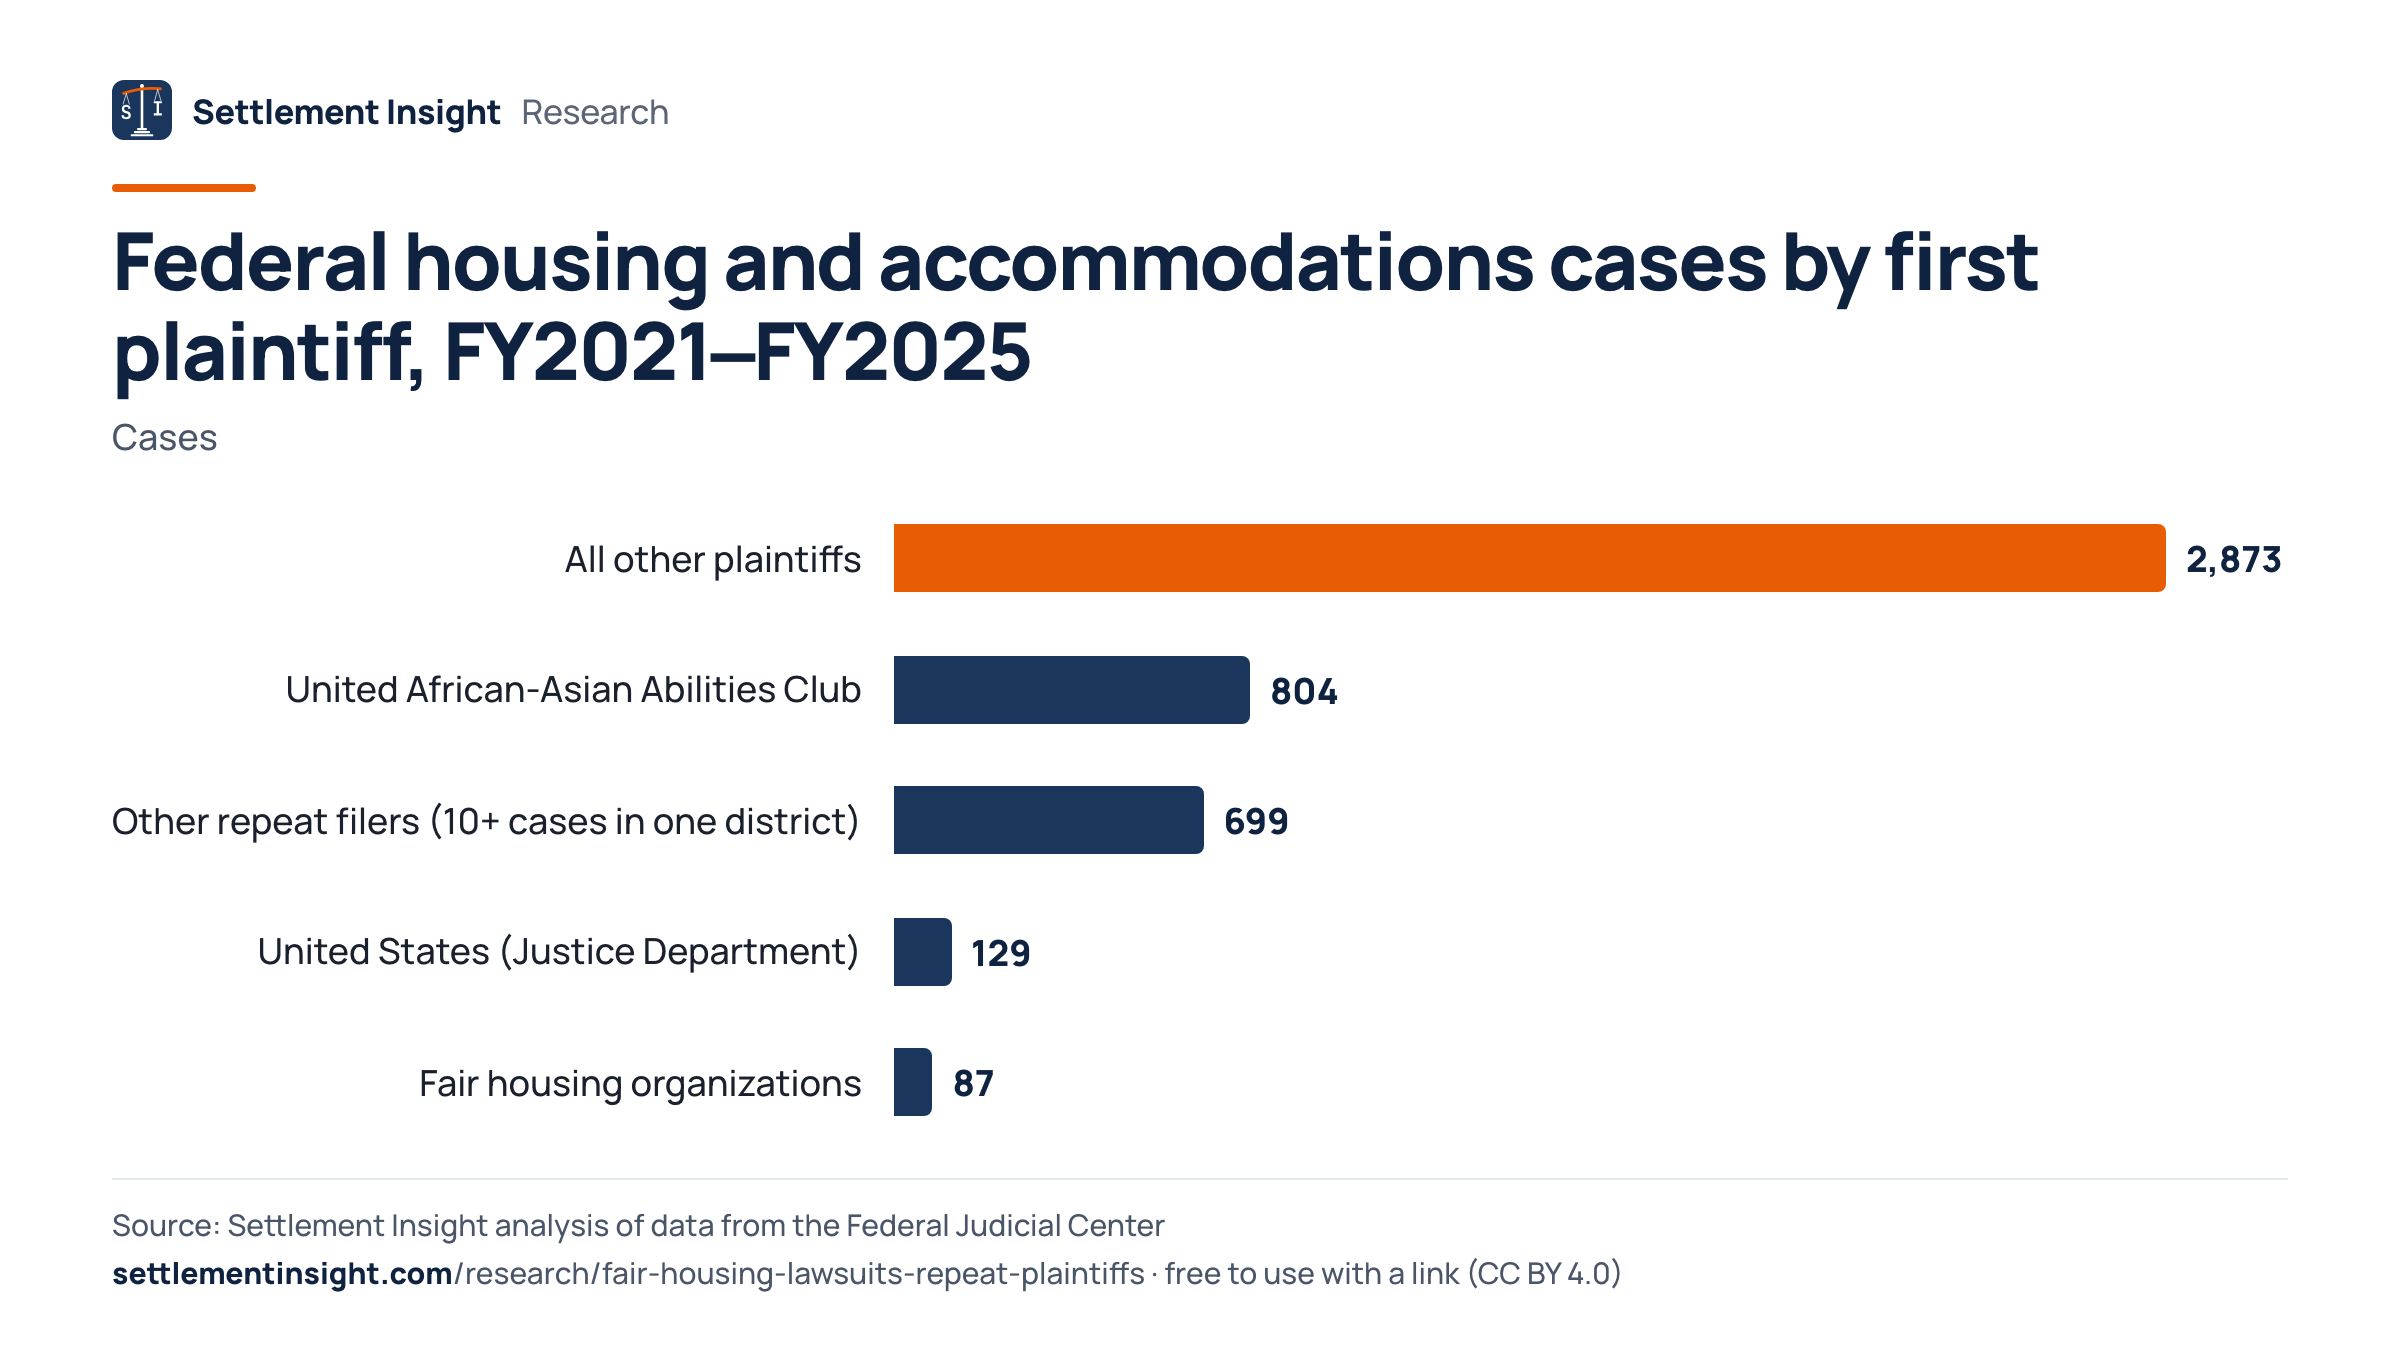
The United African-Asian Abilities Club was the first-listed plaintiff in 804 of the 4,592 housing discrimination cases commenced in U.S. district courts from FY2021 to FY2025 (17.5%), more than any other plaintiff and 6.2× as many as the United States. All of its cases were filed in the Central and Southern Districts of California. Together with other first-plaintiff names that appear on 10 or more cases in a single district, repeat filers account for 32.7% of the national total.
- 18%Share of FY2021–FY2025 cases with one first plaintiff
- 804Cases with the Club as first plaintiff
- 33%Share from repeat filers (10+ in one district)
One plaintiff, about one in six cases
The United African-Asian Abilities Club was first plaintiff in 804 of 4,592 federal housing and accommodations cases from FY2021 to FY2025 (17.5%). The next most frequent name, an individual, appears on 244.
Concentrated in Southern California
All 804 of the Club's cases were filed in two districts: 627 in the Central District of California and 177 in the Southern District. There it accounts for 77.8% of all such cases.
Repeat filers: a third of the total
Names that appear on 10 or more cases in one district, including the Club, account for 1,503 cases (32.7%). The Justice Department brought 129 and fair housing organizations 87.
One name leads in South Florida
In the Southern District of Florida, the second-busiest district with 583 cases, a single individual plaintiff accounts for 41.9% of filings. We do not name individuals.
The FY2025 rise came from elsewhere
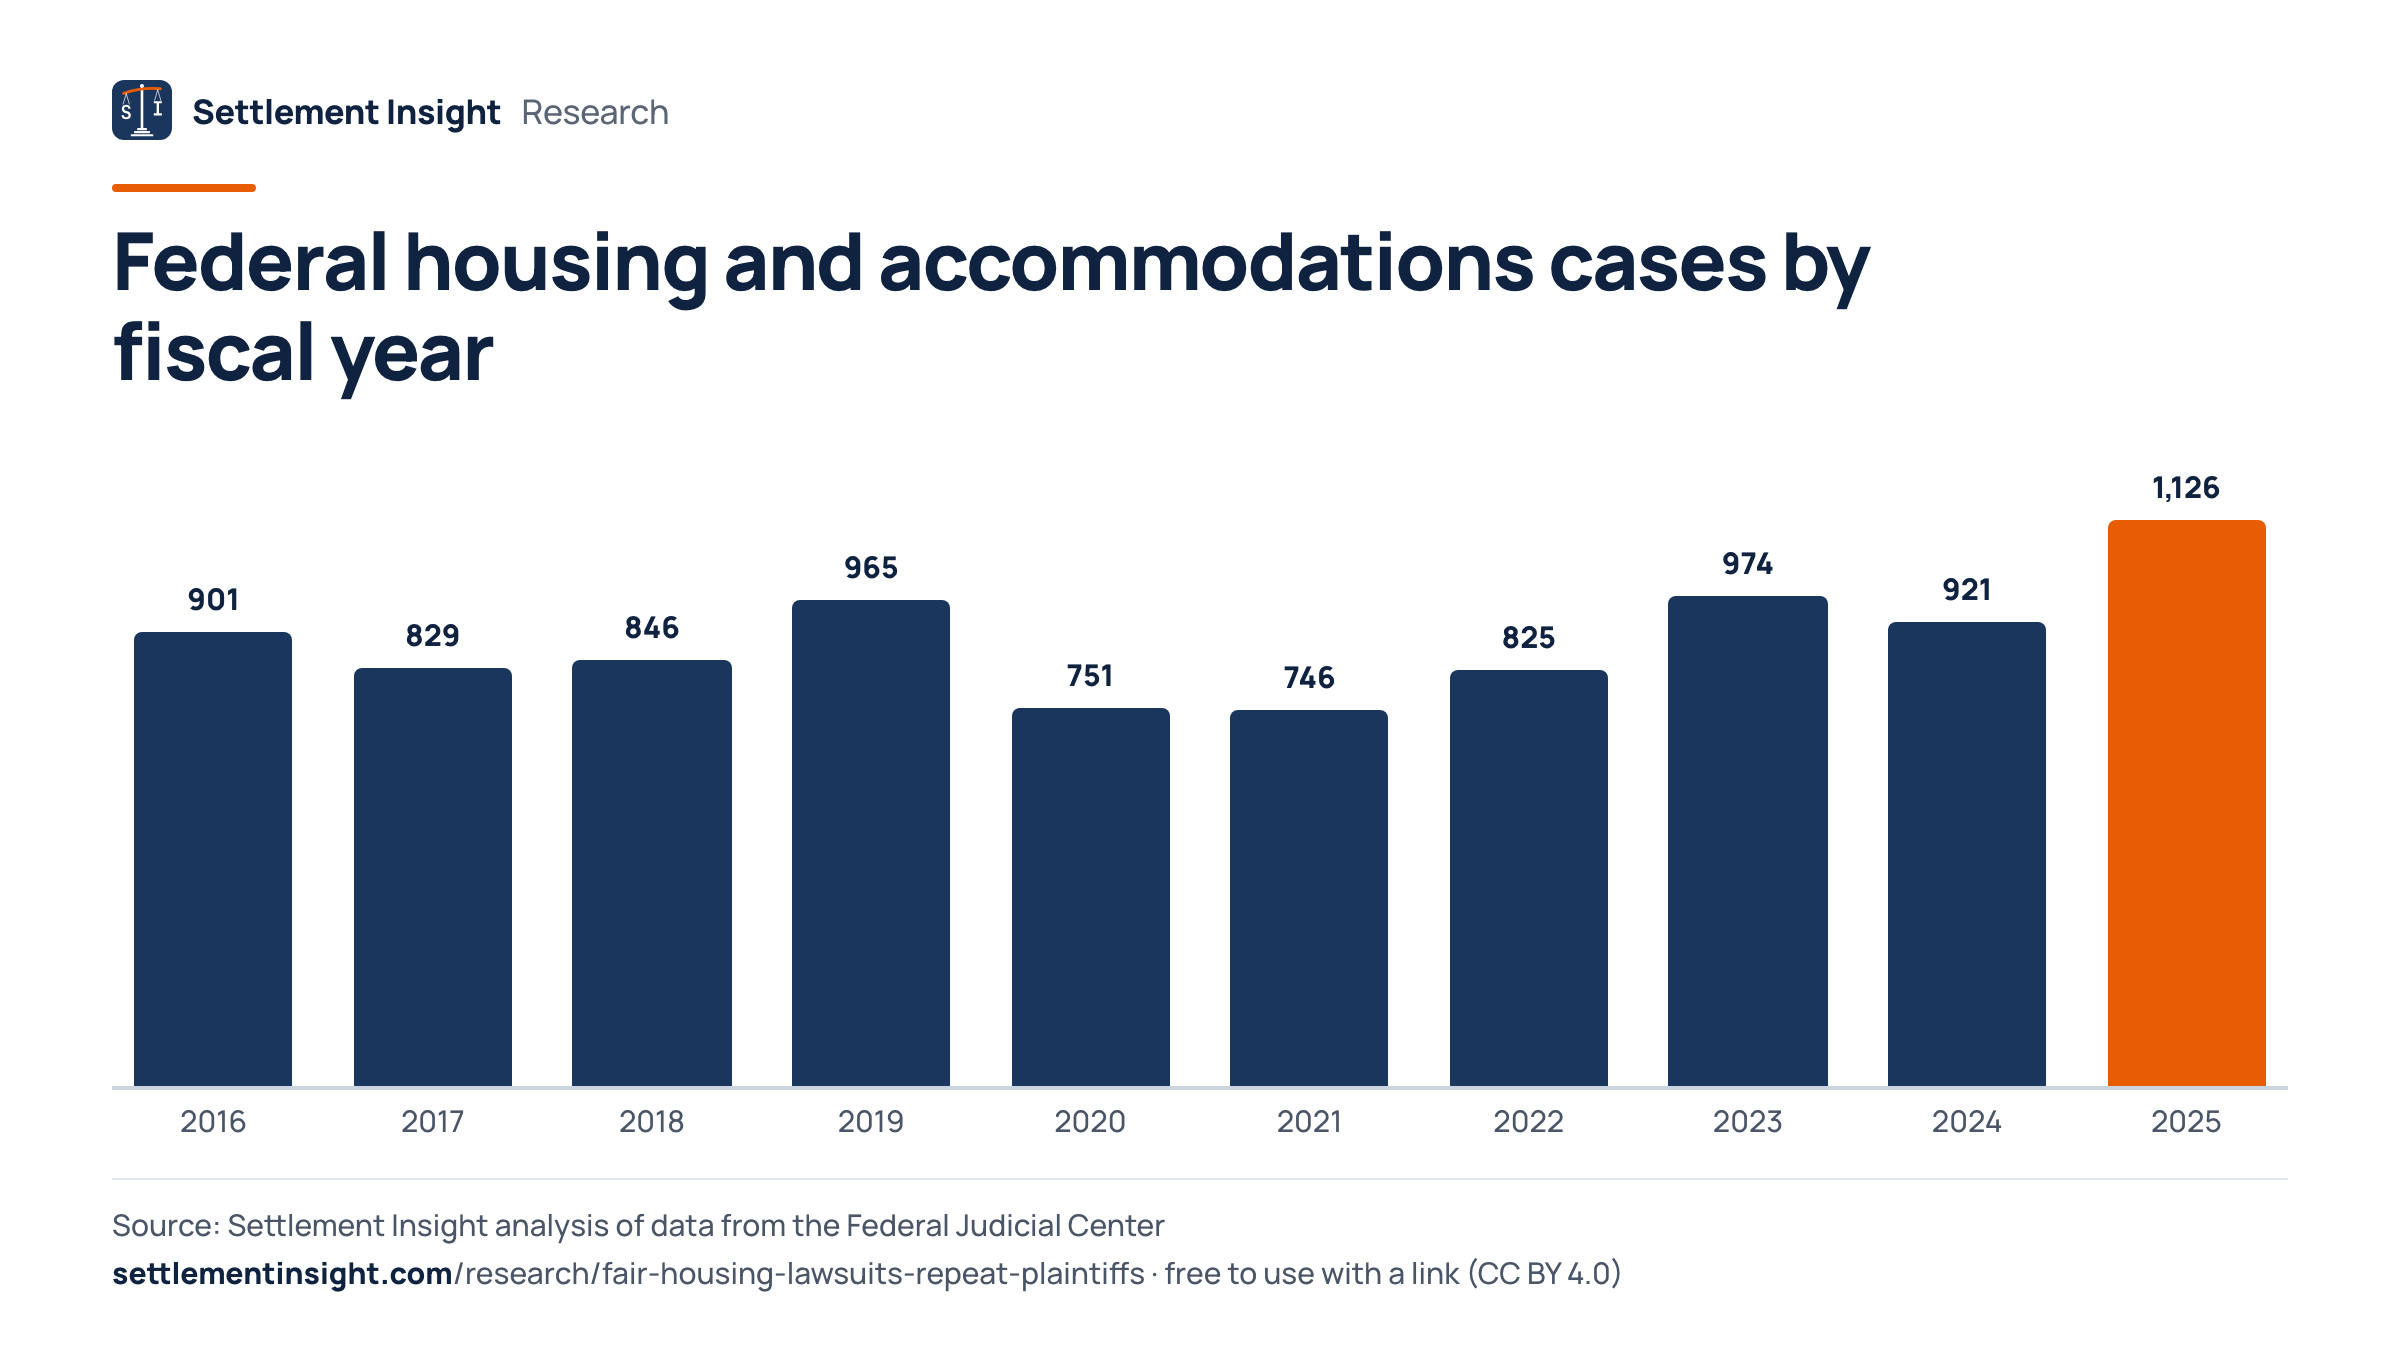
Cases rose 22.3% to 1,126 in FY2025, while the Club's filings fell from 189 to 174. Without the Club, the increase was 30.1%.
Who Files the Most Federal Housing Discrimination Lawsuits
From FY2021 to FY2025, the United African-Asian Abilities Club was first plaintiff in 804 federal housing and accommodations cases, more than the United States (129) and fair housing organizations identified by name combined (87).
The United African-Asian Abilities Club filed the most, with 804 of 4,592 cases (17.5%). Other repeat filers, all listed under personal names, account for 699 more.
The table groups each case by its first-listed plaintiff as recorded in the federal court data. Spelling variants of the Club's name were combined. A defense law firm that represents apartment owners describes the Club's suits as alleging “violations of the Fair Housing Act due to accessibility conditions at the apartment property and/or website.” The court data do not record the claims or the outcome.
“Other repeat filers” are 15 first-plaintiff names, counted separately in each district and each listed by surname only, that appear on 10 or more cases in the same district in the five years; they filed in 10 districts. The two largest account for 244 and 184 cases. Together with the Club, the three most frequent first plaintiffs account for 26.8% of all cases. We do not name individuals. The remaining 2,873 cases (62.6%) have a first plaintiff that appears fewer than 10 times in one district.
Federal housing and accommodations cases by first plaintiff, FY2021–FY2025
| Plaintiff | Cases | Share | FY2025 |
|---|---|---|---|
| All other plaintiffs | 2,873 | 62.6% | 732 |
| United African-Asian Abilities Club | 804 | 17.5% | 174 |
| Other repeat filers (10+ cases in one district) | 699 | 15.2% | 169 |
| United States (Justice Department) | 129 | 2.8% | 32 |
| Fair housing organizations | 87 | 1.9% | 19 |
FY2021–FY2025 = October 1, 2020 to September 30, 2025, the federal fiscal years used by the courts.
How Federal Housing Discrimination Cases Changed Since 2016
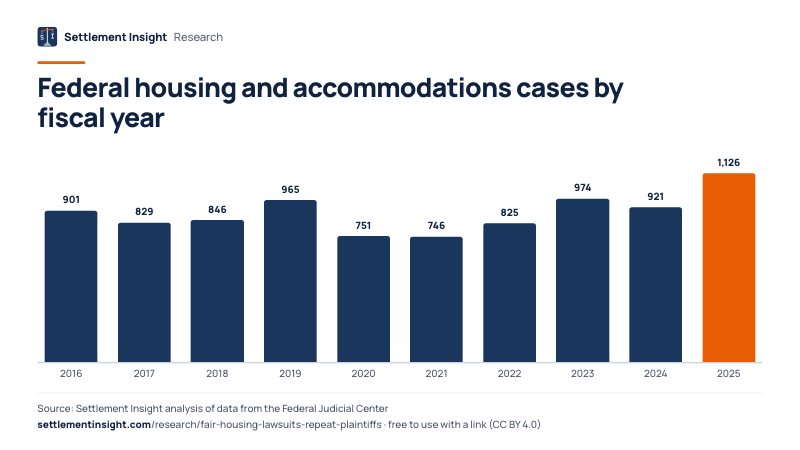
Federal housing and accommodations cases rose from 901 in FY2016 to 1,126 in FY2025. The Club's cases went from 50 to 174 over the same years.
The Club's share of all cases was highest in FY2020 at 21.0%. In FY2025 it was 15.5%, as the Club's filings fell and filings by other plaintiffs grew.
The series counts every case commenced, including cases removed from state court, transfers and reopened cases, as the judiciary does in its own statistics. The Club's filings rose each year through FY2020; in FY2025 they were 174, down from 189 in FY2024.
The jump in FY2025 did not come from the Club. Its filings fell, while cases from other plaintiffs rose 30.1%. The Southern District of Florida alone went from 113 to 152 cases.
Federal housing and accommodations cases by fiscal year
- 201690150 by the Club (5.5%)
- 201782959 by the Club (7.1%)
- 201884690 by the Club (10.6%)
- 2019965149 by the Club (15.4%)
- 2020751158 by the Club (21.0%)
- 2021746116 by the Club (15.5%)
- 2022825153 by the Club (18.5%)
- 2023974172 by the Club (17.7%)
- 2024921189 by the Club (20.5%)
- 20251,126174 by the Club (15.5%)
Fiscal year 2026 is not complete in the data and is not shown.
Where Federal Housing Discrimination Lawsuits Are Filed
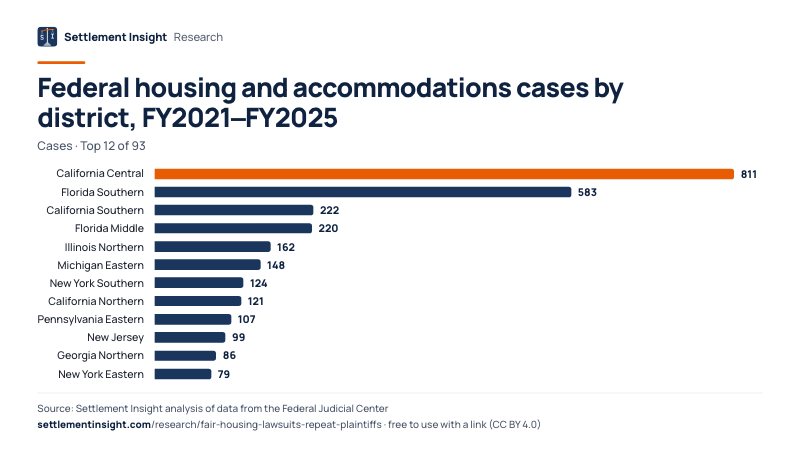
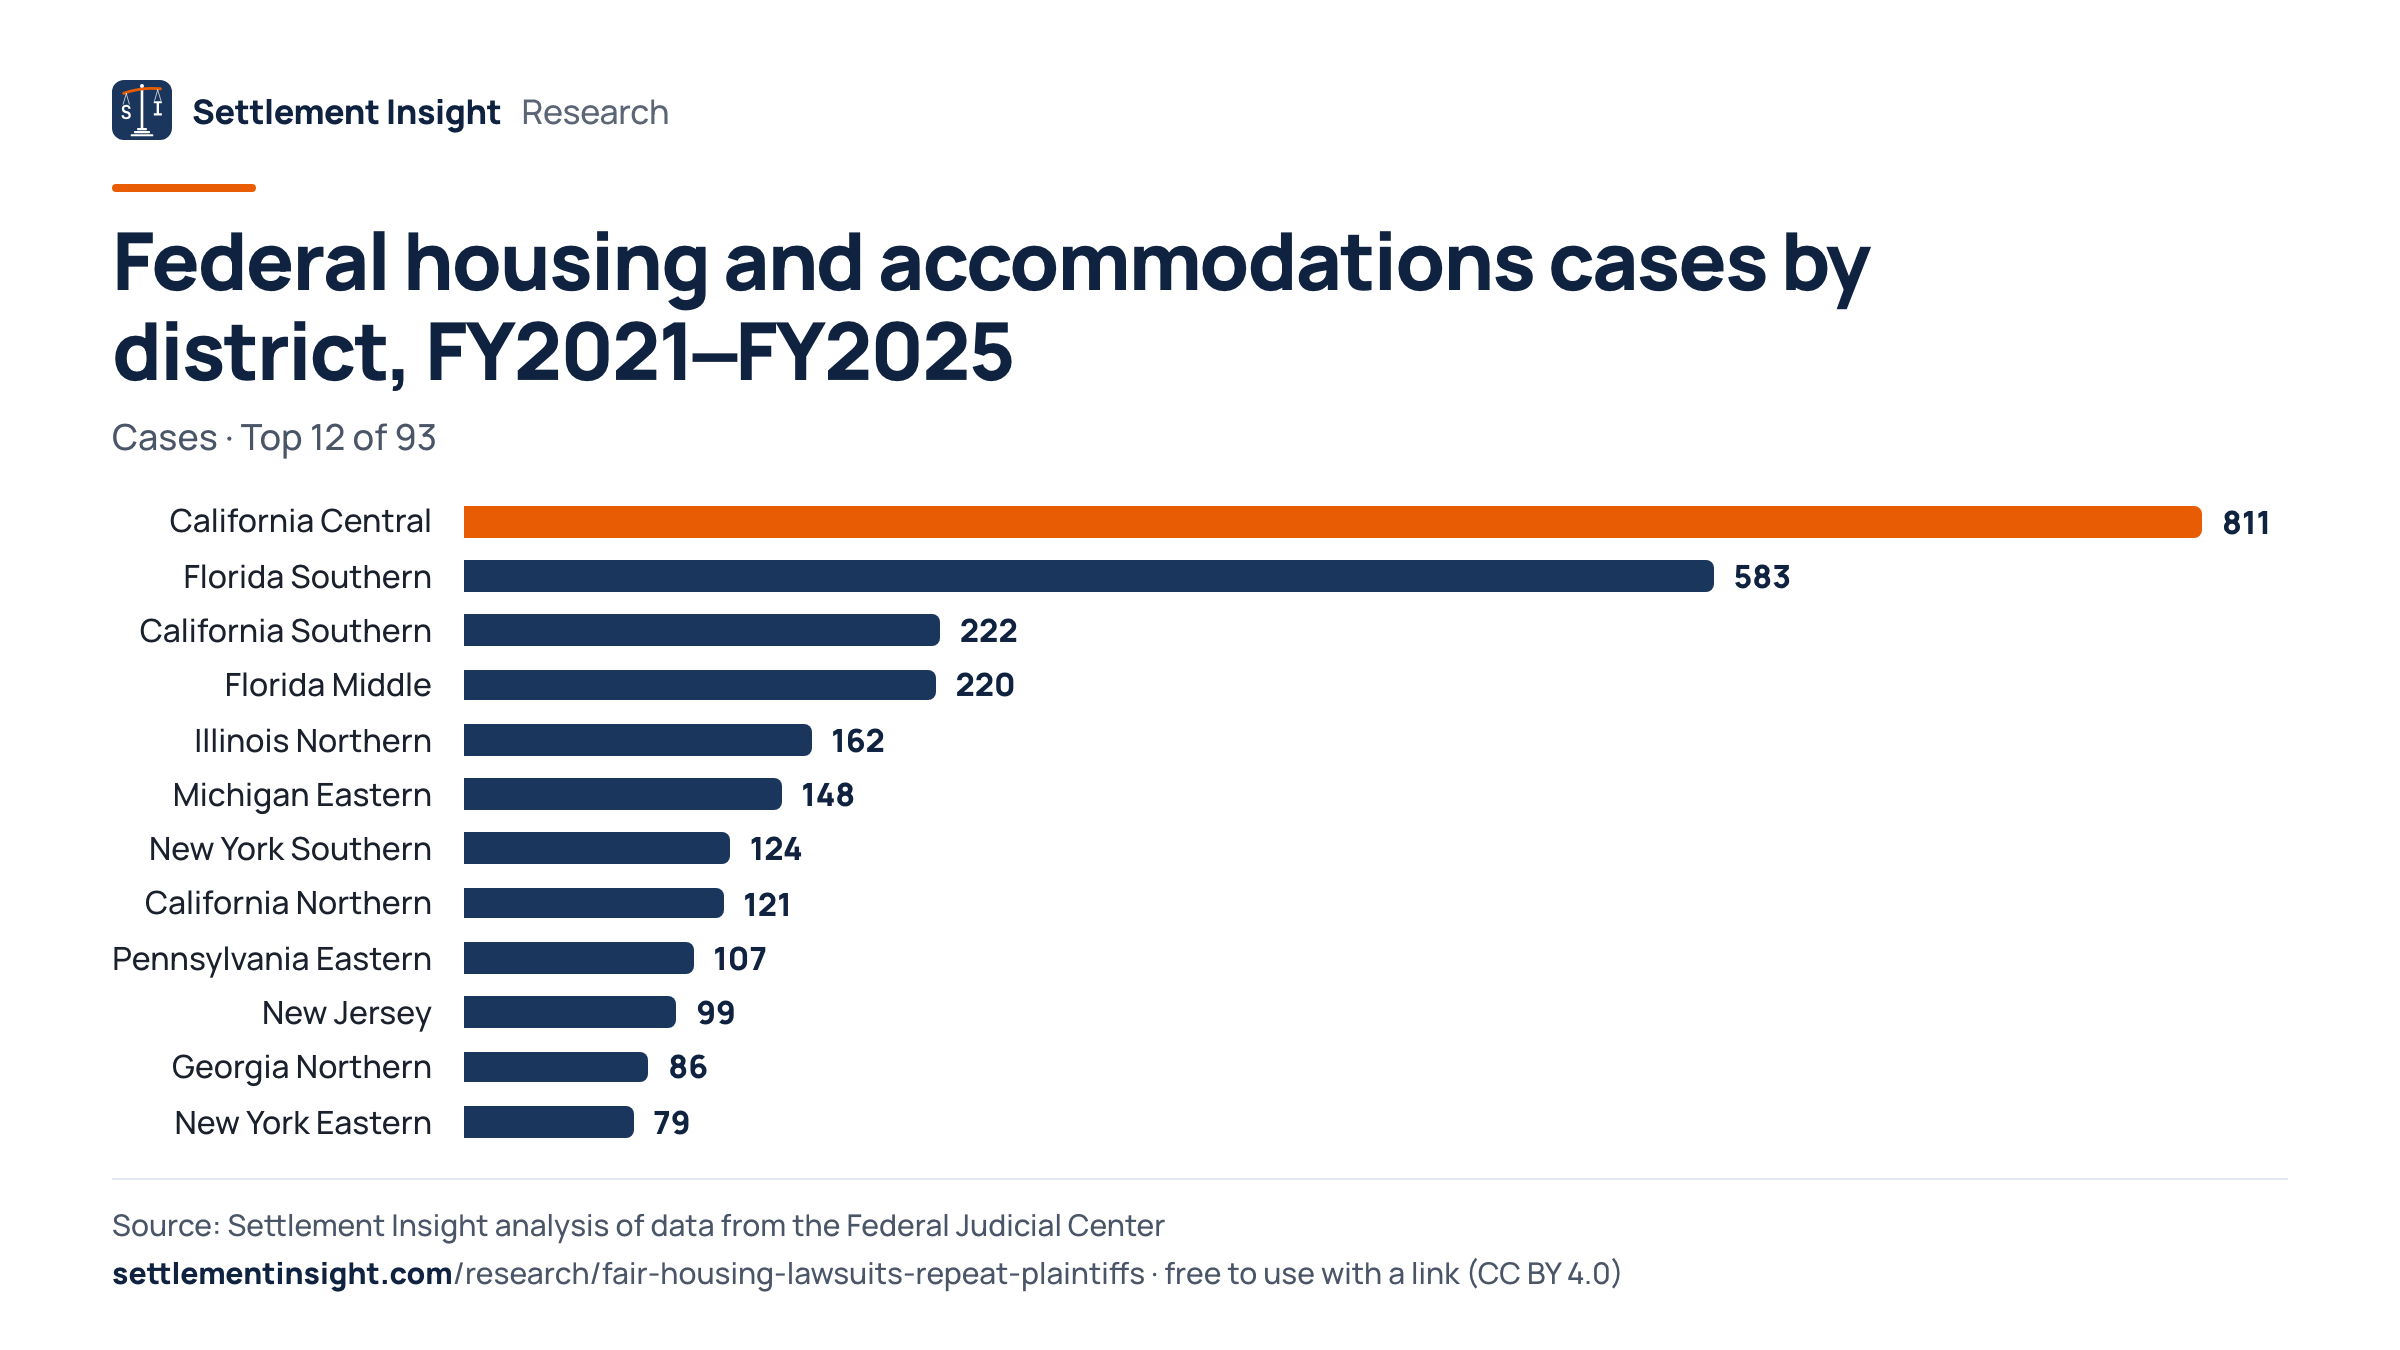
The Central District of California received 811 housing and accommodations cases from FY2021 to FY2025, more than any other federal district; 77.3% named the Club as first plaintiff.
Two districts in California and two in Florida lead. In each of the top three, one first-listed plaintiff accounts for 42% or more of the cases.
The column “Top filer” shows the share of a district's cases filed under its single most frequent first-plaintiff name. In the Southern District of Florida that name is an individual with 244 cases. Cases were filed in 93 districts. Counts are not adjusted for population or the number of rental homes in each district.
Federal housing and accommodations cases by district, FY2021–FY2025
| District | Cases | Club | Top filer |
|---|---|---|---|
| California Central | 811 | 627 | 77.3% |
| Florida Southern | 583 | 0 | 41.9% |
| California Southern | 222 | 177 | 79.7% |
| Florida Middle | 220 | 0 | 17.7% |
| Illinois Northern | 162 | 0 | 6.8% |
| Michigan Eastern | 148 | 0 | 25.7% |
| New York Southern | 124 | 0 | 4.8% |
| California Northern | 121 | 0 | 4.1% |
| Pennsylvania Eastern | 107 | 0 | 7.5% |
| New Jersey | 99 | 0 | 5.1% |
| Georgia Northern | 86 | 0 | 7.0% |
| New York Eastern | 79 | 0 | 8.9% |
All districts
| District | Cases | Club | Top filer |
|---|---|---|---|
| Maryland | 75 | 0 | 5.3% |
| Texas Northern | 67 | 0 | 11.9% |
| California Eastern | 64 | 0 | 3.1% |
| Minnesota | 60 | 0 | 5.0% |
| Massachusetts | 58 | 0 | 6.9% |
| Oregon | 57 | 0 | 8.8% |
| Colorado | 55 | 0 | 5.5% |
| Ohio Northern | 54 | 0 | 20.4% |
| New York Northern | 53 | 0 | 39.6% |
| Tennessee Middle | 51 | 0 | 19.6% |
| Ohio Southern | 48 | 0 | 12.5% |
| Texas Southern | 47 | 0 | 29.8% |
| Washington Western | 44 | 0 | 6.8% |
| Indiana Southern | 42 | 0 | 21.4% |
| Arizona | 36 | 0 | 2.8% |
| Missouri Western | 36 | 0 | 8.3% |
| Virginia Eastern | 36 | 0 | 8.3% |
| Louisiana Eastern | 35 | 0 | 8.6% |
| Pennsylvania Western | 34 | 0 | 14.7% |
| Texas Eastern | 34 | 0 | 14.7% |
| Nevada | 33 | 0 | 9.1% |
| Connecticut | 32 | 0 | 9.4% |
| Florida Northern | 32 | 0 | 59.4% |
| Missouri Eastern | 32 | 0 | 15.6% |
| Texas Western | 31 | 0 | 12.9% |
| Pennsylvania Middle | 28 | 0 | 17.9% |
| Alabama Northern | 25 | 0 | 8.0% |
| District of Columbia | 25 | 0 | 8.0% |
| Hawaii | 25 | 0 | 16.0% |
| Indiana Northern | 25 | 0 | 20.0% |
| Michigan Western | 25 | 0 | 8.0% |
| South Carolina | 25 | 0 | 4.0% |
| Tennessee Western | 23 | 0 | 30.4% |
| Kansas | 22 | 0 | 4.5% |
| New York Western | 21 | 0 | 9.5% |
| Rhode Island | 20 | 0 | 10.0% |
| Wisconsin Eastern | 20 | 0 | 15.0% |
| Oklahoma Western | 18 | 0 | 22.2% |
| Utah | 18 | 0 | 11.1% |
| North Carolina Middle | 17 | 0 | 11.8% |
| North Carolina Western | 16 | 0 | 12.5% |
| Maine | 15 | 0 | 20.0% |
| Idaho | 14 | 0 | 7.1% |
| Illinois Central | 14 | 0 | 14.3% |
| Louisiana Western | 14 | 0 | 21.4% |
| Nebraska | 14 | 0 | 14.3% |
| New Hampshire | 14 | 0 | 28.6% |
| Tennessee Eastern | 14 | 0 | 28.6% |
| Virginia Western | 14 | 0 | 14.3% |
| North Carolina Eastern | 13 | 0 | 15.4% |
| New Mexico | 12 | 0 | 8.3% |
| Oklahoma Northern | 12 | 0 | 8.3% |
| Alabama Middle | 11 | 0 | 18.2% |
| Kentucky Eastern | 11 | 0 | 27.3% |
| Guam | 9 | 0 | 100.0% |
| Mississippi Southern | 9 | 0 | 11.1% |
| Washington Eastern | 9 | 0 | 11.1% |
| Wisconsin Western | 9 | 0 | 22.2% |
| Georgia Middle | 8 | 0 | 25.0% |
| Oklahoma Eastern | 8 | 0 | 25.0% |
| South Dakota | 8 | 0 | 12.5% |
| Alabama Southern | 7 | 0 | 14.3% |
| Arkansas Eastern | 7 | 0 | 14.3% |
| Delaware | 7 | 0 | 28.6% |
| Georgia Southern | 7 | 0 | 28.6% |
| Montana | 7 | 0 | 28.6% |
| Kentucky Western | 6 | 0 | 16.7% |
| Louisiana Middle | 6 | 0 | 16.7% |
| West Virginia Southern | 6 | 0 | 16.7% |
| Illinois Southern | 5 | 0 | 20.0% |
| Iowa Northern | 5 | 0 | 40.0% |
| North Dakota | 5 | 0 | 40.0% |
| Puerto Rico | 5 | 0 | 40.0% |
| Arkansas Western | 4 | 0 | 25.0% |
| Iowa Southern | 4 | 0 | 25.0% |
| Vermont | 4 | 0 | 25.0% |
| Wyoming | 4 | 0 | 50.0% |
| Mississippi Northern | 3 | 0 | 33.3% |
| Virgin Islands | 3 | 0 | 33.3% |
| Alaska | 2 | 0 | 50.0% |
| West Virginia Northern | 2 | 0 | 100.0% |
Download the Data and Cite This Study
Every table as a CSV file and in one Excel workbook, a short PDF summary and every chart as an image, free to reuse with attribution (CC BY 4.0).
- Federal housing and accommodations civil rights cases by district, FY2021-FY2025Cases commenced per U.S. district court in FY2021-FY2025 with the count and share of the single most frequent first-listed plaintiff name. · 93 rows · CSV, 3 KB
- Federal housing and accommodations civil rights cases by fiscal year, FY2016-FY2025Cases commenced per federal fiscal year, cases with the United African-Asian Abilities Club as first plaintiff, and the judiciary's published count from Table C-2A. · 10 rows · CSV, 1 KB
- Federal housing and accommodations civil rights cases by plaintiff group, FY2021-FY2025Cases (nature of suit 443) commenced in U.S. district courts in FY2021-FY2025 and FY2025, grouped by type of first-listed plaintiff; individuals are not named. · 5 rows · CSV, 1 KB
- All tables in one Excel workbookOne sheet per table plus an About sheet with sources, method and citation · Excel (.xlsx), 14 KB
- Summary to print or forward (3 pages)Short answer, key figures, main chart, findings, method and citation · PDF, 209 KB
Charts for your story
Federal housing and accommodations cases by first plaintiff, FY2021–FY2025
Embed this chart
Federal housing and accommodations cases by fiscal year
Embed this chart
Federal housing and accommodations cases by district, FY2021–FY2025
Embed this chart
How to cite
Goldberg, L. (2026). Federal housing discrimination lawsuits — cases by first plaintiff and district (FY2016–FY2025) [Data set]. Settlement Insight. https://settlementinsight.com/research/fair-housing-lawsuits-repeat-plaintiffs
BibTeX
@dataset{goldberg_2026_fair_housing_lawsuits_repeat_plaintiffs,
  author    = {Goldberg, Leonard},
  title     = {Federal housing discrimination lawsuits --- cases by first plaintiff and district (FY2016--FY2025)},
  year      = {2026},
  publisher = {Settlement Insight},
  url       = {https://settlementinsight.com/research/fair-housing-lawsuits-repeat-plaintiffs}
}How We Measured
Checked against published figures
- Housing and accommodations civil rights cases commenced in U.S. district courts, FY2021: published 742, our count 746 (0.54% apart).Table C-2A. U.S. District Courts - Civil Cases Commenced, by Nature of Suit, During the 12-Month Periods Ending September 30, 2021 through 2025
- Housing and accommodations civil rights cases commenced in U.S. district courts, FY2022: published 823, our count 825 (0.24% apart).Table C-2A. U.S. District Courts - Civil Cases Commenced, by Nature of Suit, During the 12-Month Periods Ending September 30, 2021 through 2025
- Housing and accommodations civil rights cases commenced in U.S. district courts, FY2023: published 977, our count 974 (0.31% apart).Table C-2A. U.S. District Courts - Civil Cases Commenced, by Nature of Suit, During the 12-Month Periods Ending September 30, 2021 through 2025
- Housing and accommodations civil rights cases commenced in U.S. district courts, FY2024: published 922, our count 921 (0.11% apart).Table C-2A. U.S. District Courts - Civil Cases Commenced, by Nature of Suit, During the 12-Month Periods Ending September 30, 2021 through 2025
- Housing and accommodations civil rights cases commenced in U.S. district courts, FY2025: published 1,124, our count 1,126 (0.18% apart).Table C-2A. U.S. District Courts - Civil Cases Commenced, by Nature of Suit, During the 12-Month Periods Ending September 30, 2021 through 2025
Full method and limits of the data
We selected all records with nature of suit code 443 (“Housing/Accommodations”, the civil rights code for actions under the Fair Housing Act) and a filing date from October 1, 2015 to September 30, 2025, and assigned each to a federal fiscal year (October to September). Each record is one case commenced, as in the judiciary's own tables: original filings, removals, transfers and reopened cases. We removed 3 duplicate records in FY2021–FY2025 that carried the same district, docket number and filing date.
For FY2021–FY2025 we grouped the first-listed plaintiff. Spelling variants of the United African-Asian Abilities Club were combined. Cases with the United States as plaintiff form their own group: every first-plaintiff name beginning with “United States”, “The United States” or “USA”, including the truncated forms of “United States of America” in the FJC records. Fair housing organizations (by name) form another group. A “repeat filer” is any other first-plaintiff name, with “et al.” removed, that appears on 10 or more cases in the same district. Everything else is reported only in aggregate.
To check the data, we recomputed the judiciary's published counts. Table C-2A of the Judicial Business statistics lists 4,588 housing and accommodations cases commenced in FY2021–FY2025, including 1,124 in FY2025 and 922 in FY2024. Our count of 4,592 differs by 0.09%; each single year is within five cases.
What this data cannot tell you
- The data record only the first-listed plaintiff, in shortened form. An organization or person named second or later is not counted, so the Club's share is a count of cases it leads, not of every case it joined.
- Individuals are matched by surname within a district. Two people with the same surname in the same district would be counted as one repeat filer, and spelling variants of one person's name would be split. The repeat-filer total is an approximation.
- Nature of suit 443 is chosen by the filer on the civil cover sheet. Some cases under this code may concern public accommodations rather than housing, and housing claims filed under other codes are not included.
- The counts say nothing about whether the claims had merit or how the cases ended. A case count is not a measure of discrimination, and it is not adjusted for the number of rental homes in each district.
- Courts can correct or add records after the fact. FY2025 ended more than a year before this analysis, but a later FJC release may change individual counts slightly.
Frequently Asked Questions
Who files the most federal housing discrimination lawsuits?
The United African-Asian Abilities Club was the first-listed plaintiff in 804 of 4,592 federal housing and accommodations cases from FY2021 to FY2025 (17.5%), more than any other plaintiff. The United States brought 129.
How many fair housing lawsuits are filed in federal court each year?
The judiciary counted 1,124 housing and accommodations civil rights cases commenced in U.S. district courts in FY2025, up from 922 in FY2024. Our count from the FJC data is 1,126 for FY2025.
What is the United African-Asian Abilities Club?
It is an organization that was the first-listed plaintiff in 804 federal housing cases from FY2021 to FY2025, all in the Central and Southern Districts of California. A defense law firm describes the suits as alleging Fair Housing Act accessibility violations at apartment properties and websites; the court data do not record the claims.
How many federal housing discrimination lawsuits come from repeat plaintiffs?
First-plaintiff names that appear on 10 or more cases in one district, including the Club, account for 1,503 of 4,592 cases from FY2021 to FY2025 (32.7%). Matching individuals by surname makes this figure an approximation.
Which federal court gets the most fair housing lawsuits?
The Central District of California received 811 housing and accommodations cases from FY2021 to FY2025, followed by the Southern District of Florida with 583. In both, one first-listed plaintiff accounts for a large share of the cases.
Did federal fair housing lawsuits increase in 2025?
Yes. Our count rose 22.3% from 921 in FY2024 to 1,126 in FY2025. The Club's filings fell over the same period, so the increase came from other plaintiffs.
Sources
- Integrated Database (IDB) — civil cases — Federal Judicial Center
- Table C-2A. U.S. District Courts—Civil Cases Commenced, by Nature of Suit, During the 12-Month Periods Ending September 30, 2021 through 2025 — Administrative Office of the U.S. Courts
- Civil Nature of Suit Code Descriptions (JS 44) — U.S. District Court for the District of Columbia
- The Integrated Database: A Research Guide — Federal Judicial Center
- United African Asian Abilities Club Sue Apartment Buildings: How to Respond (ADA Compliance and Defense Blog) — Jeffer Mangels Butler & Mitchell LLP
 Independent analysis. Settlement Insight is not a law firm and not affiliated with any agency named here. Analysis by Leonard Goldberg, Editor. How we work: methodology, our data.
More Research and Data
Other studies from our database of public legal records — each with free CSV downloads.
Related research
- Federal lawsuit outcomesHow federal civil cases end, by type of case.
- Self-represented litigants in federal courtThe share of federal civil cases filed without a lawyer.
- Federal foreclosure lawsuits by servicerWhich mortgage companies file the most federal foreclosure cases.
- Employment discrimination lawsuits by stateFederal employment discrimination cases across the states.
Latest studies
- Debt collector lawsuit complaintsEncore (Midland) drew 1,034 CFPB debt-lawsuit complaints in 2024–2025, more than any other company
- Identity Theft Debt ComplaintsEquifax, TransUnion and Experian: 47% of 2025 identity-theft debt collection complaints to the CFPB
- PFAS Makers in Land Lawsuits28.0% of FY2025 federal torts-to-land case records, incl. MDL transfers, named a PFAS maker first
- Seattle gig companies' share88% of Seattle's 2025 labor-standards remedies came from gig companies