Which Mortgage Companies Filed the Most Federal Foreclosure Lawsuits in FY2025
Original analysis of 71,299 records from the Federal Judicial Center, FY2005–FY2025 (federal fiscal years, Oct–Sep). Published October 16, 2026.
We counted every foreclosure case (nature of suit 220) filed in or removed to U.S. district courts from FY2005 to FY2025 and grouped the fiscal 2024 and 2025 cases by the company named as plaintiff.
Who is behind the rise in federal foreclosure cases
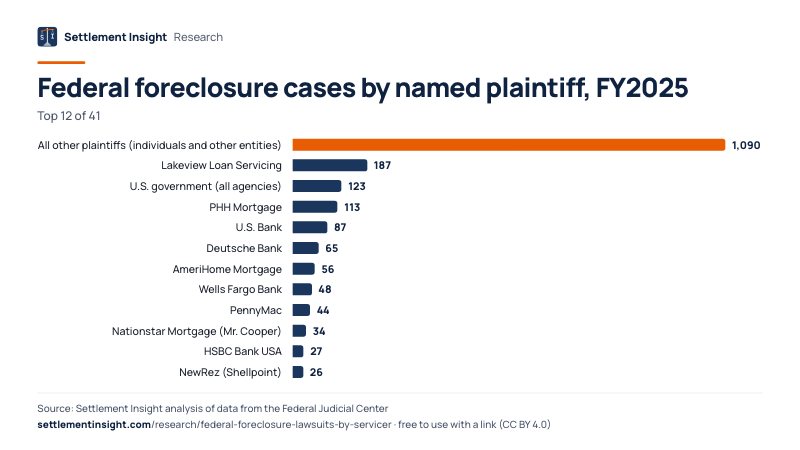
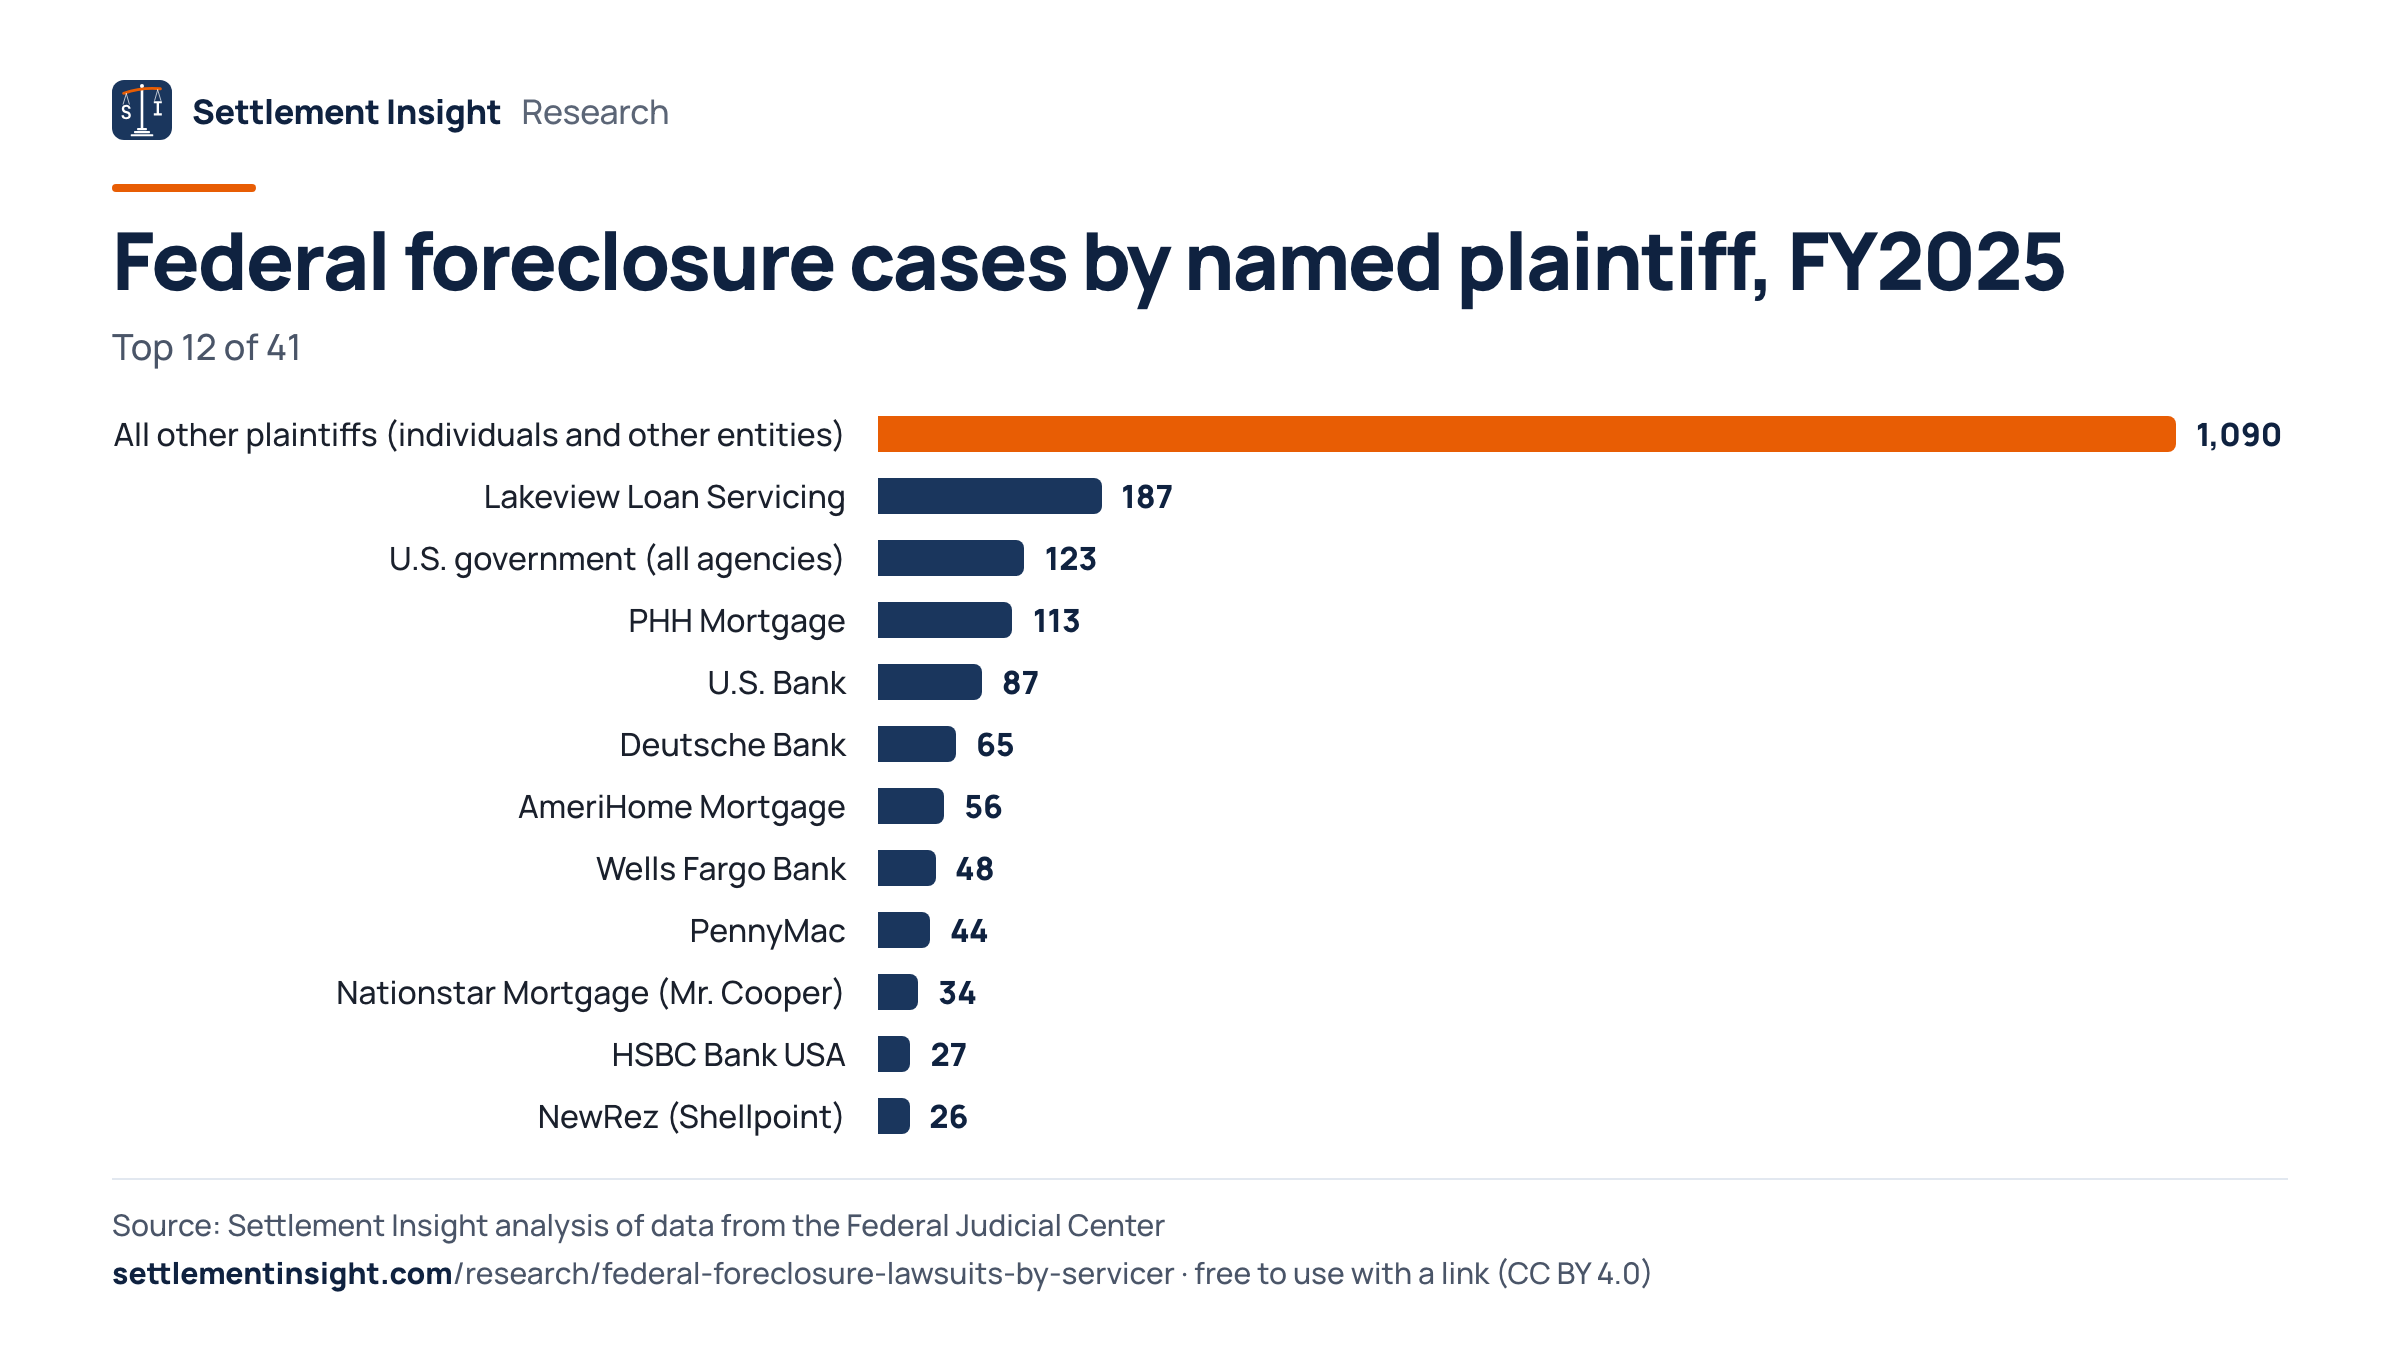
Lakeview Loan Servicing was the named plaintiff in 187 of the 2,120 foreclosure cases filed in U.S. district courts in fiscal year 2025 (8.8%), more than any other party, including the federal government. PHH Mortgage followed with 113. Lakeview, PHH, AmeriHome Mortgage and PennyMac together went from 13 cases in FY2024 to 400, which accounts for 42.9% of the 903-case rise.
- 187Cases with Lakeview as plaintiff, FY2025
- 74%Rise in federal foreclosure cases vs. FY2024
- 43%Share of the rise from four servicers
Lakeview leads all plaintiffs
Lakeview Loan Servicing was the plaintiff in 187 federal foreclosure cases in FY2025, up from 8 a year earlier. The federal government, counting all agencies, brought 123.
PHH appears on both sides
PHH Mortgage was the plaintiff in 113 federal foreclosure cases in FY2025, up from 1 the year before. In 70 other FY2025 foreclosure cases it was the first-listed defendant.
Four servicers, two-fifths of the rise
Lakeview, PHH, AmeriHome and PennyMac added 387 cases between FY2024 and FY2025, 42.9% of the total increase of 903.
Highest count since FY2019
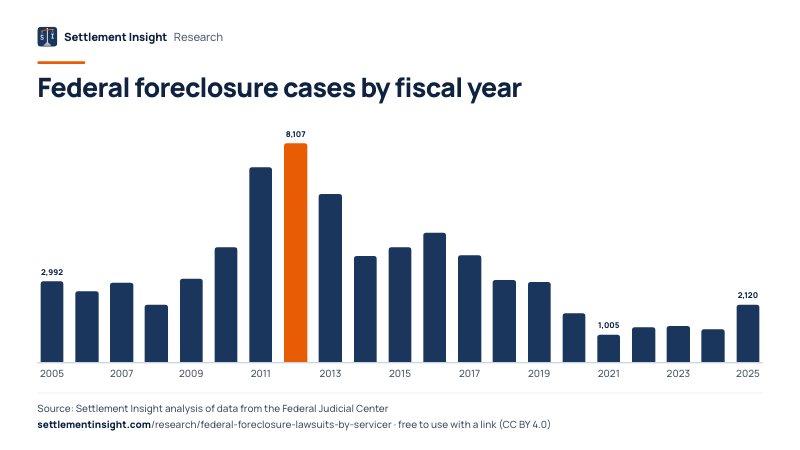
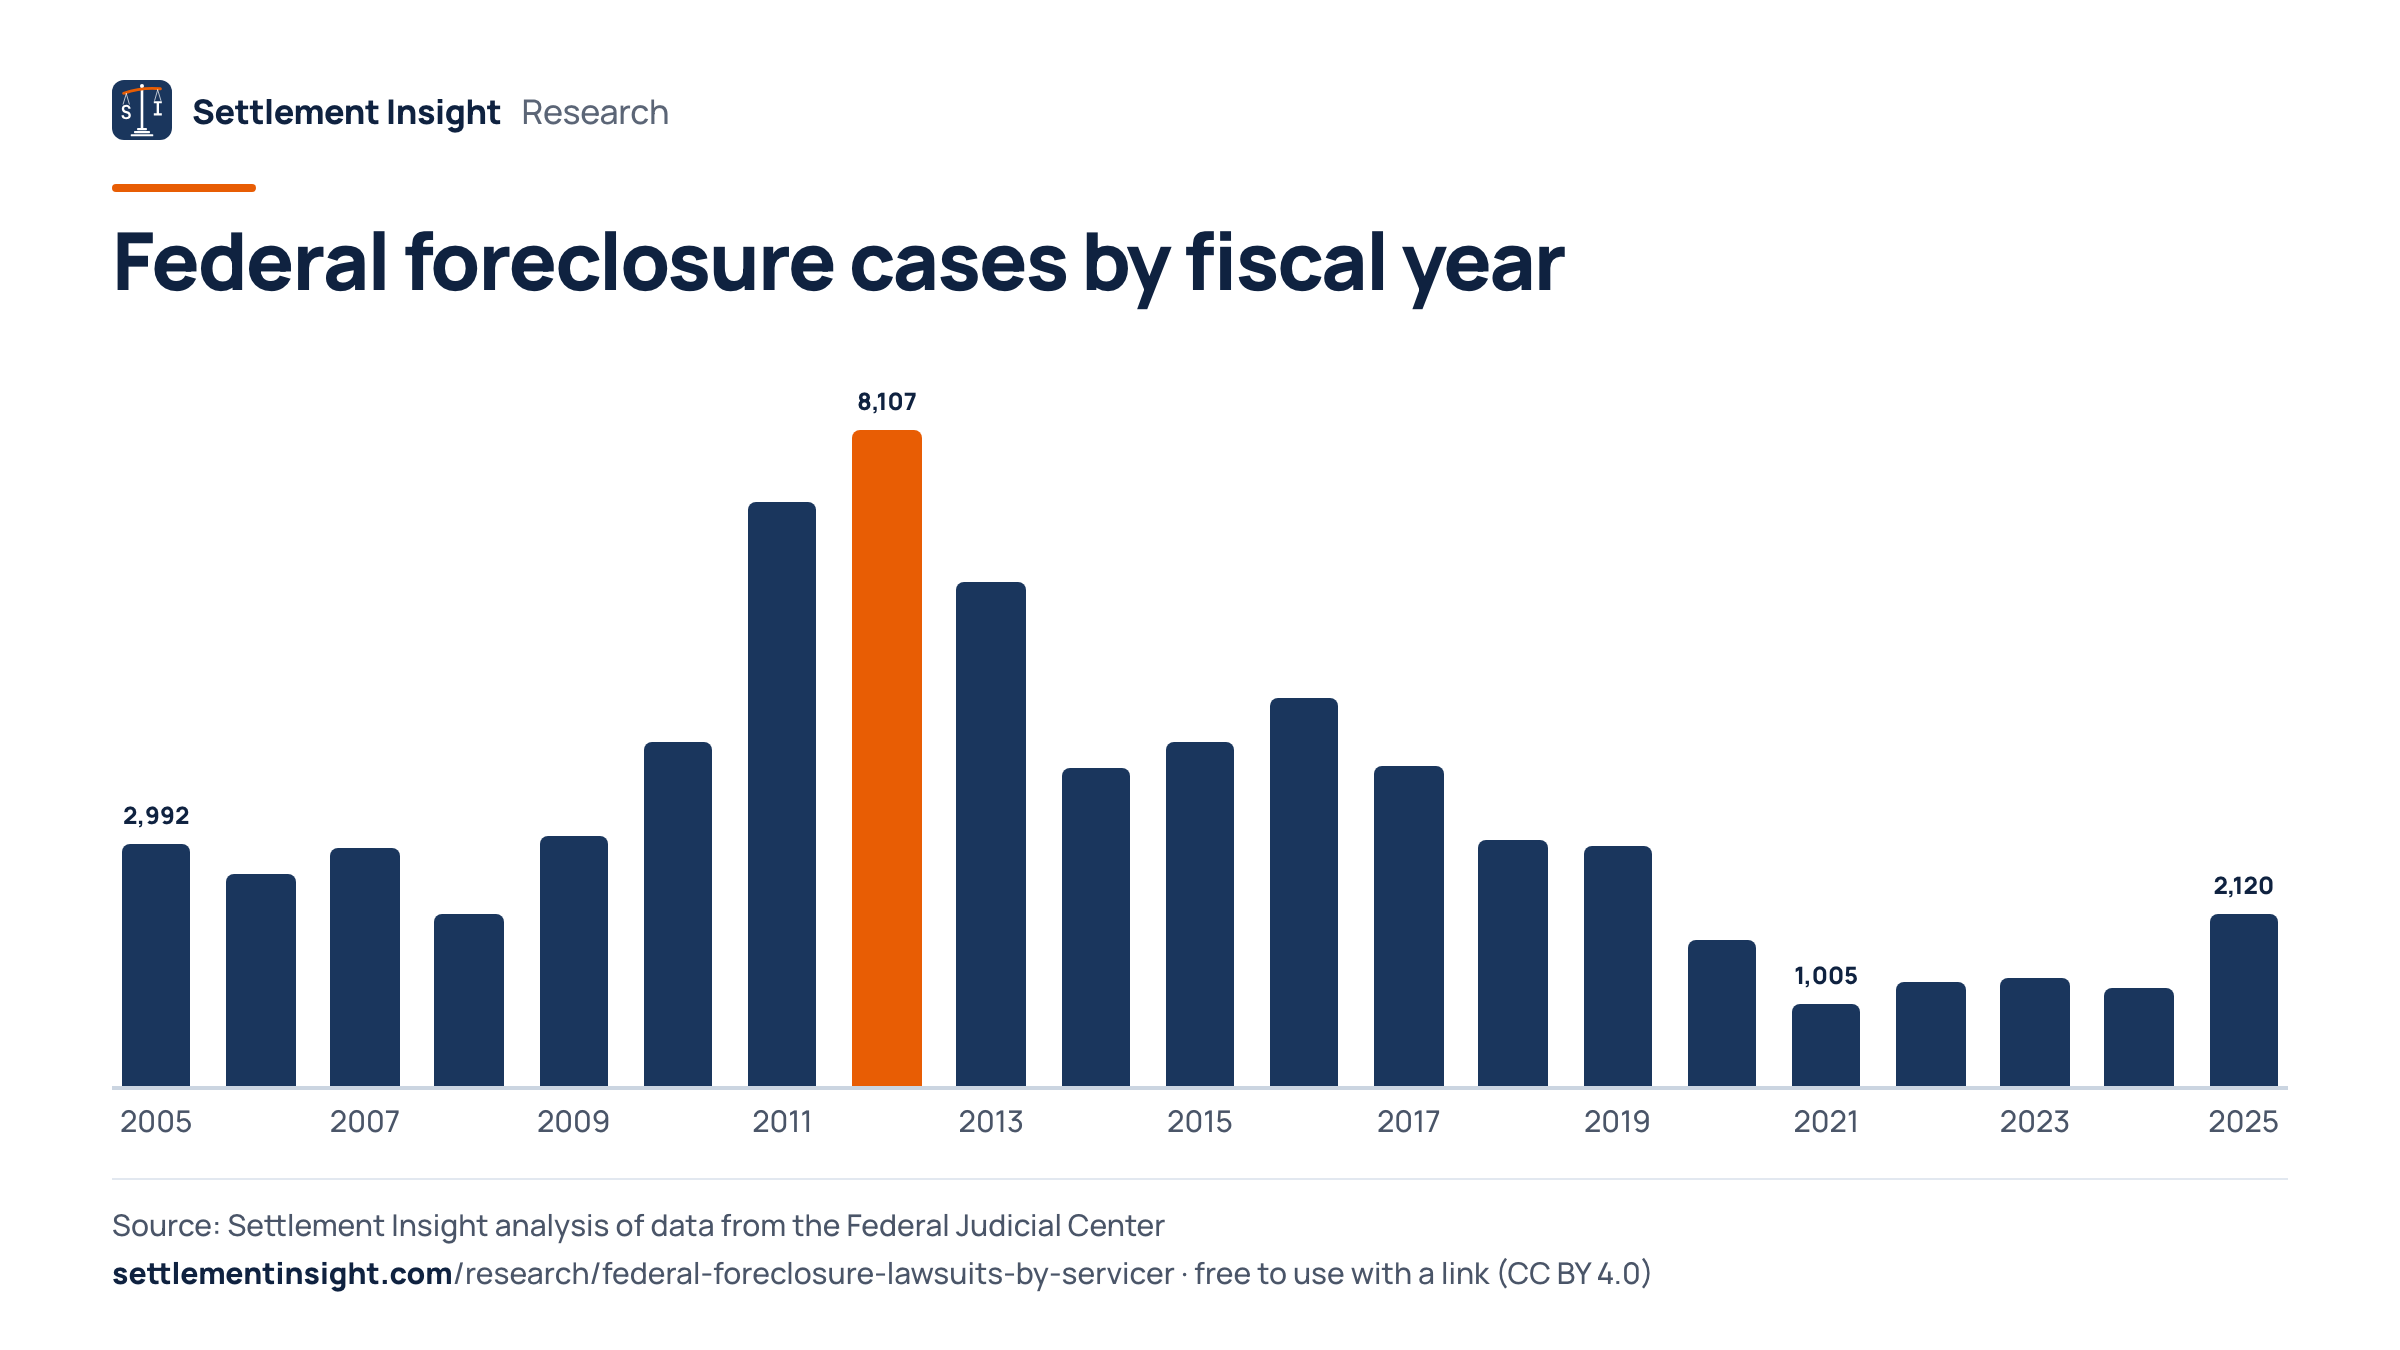
The 2,120 cases in FY2025 are the most since fiscal 2019 (2,963) but remain far below the FY2012 peak of 8,107.
A third were filed in Texas
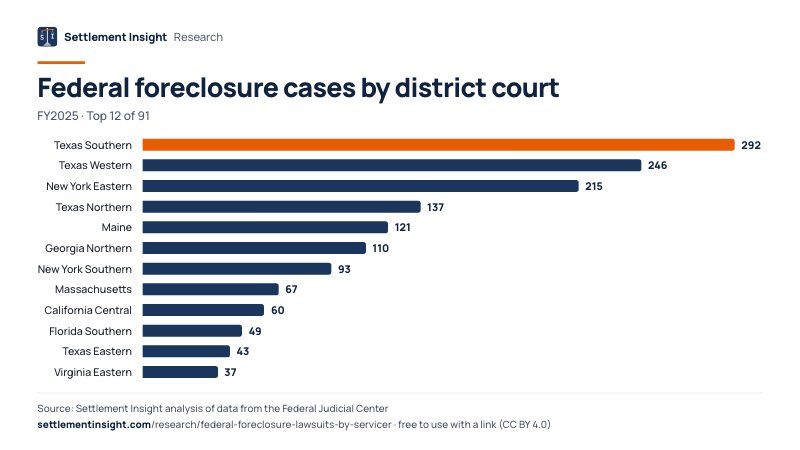
The four federal districts in Texas received 718 foreclosure cases in FY2025 (33.9% of the national total), up from 366. The Southern District of Texas led all districts with 292.
Which Mortgage Companies Filed the Most Foreclosure Lawsuits
The mortgage servicers and lenders we grouped by name were the named plaintiff in 544 federal foreclosure cases in FY2025, up from 59 in FY2024.
Lakeview Loan Servicing (187 cases), PHH Mortgage (113), U.S. Bank and Deutsche Bank led the FY2025 ranking of named plaintiffs.
The ranking counts cases by the first-listed plaintiff as recorded in the federal court data. Name variants of the same company (for example with or without “LLC”, or with “et al.”) were combined into one group. Banks such as U.S. Bank, Deutsche Bank and Wilmington Savings Fund Society often appear as trustee for a securitization trust; the company that services the loan is not identified in the data.
Lakeview’s cases rose from 8 to 187; 37 of the FY2025 cases began in state court and were removed to federal court. The ranking does not account for the size of each company’s loan portfolio.
Federal foreclosure cases by named plaintiff, FY2025
- Lakeview Loan Servicing1878 in FY2024
- PHH Mortgage1131 in FY2024
- U.S. Bank8772 in FY2024
- Deutsche Bank6516 in FY2024
- AmeriHome Mortgage562 in FY2024
- Wells Fargo Bank4826 in FY2024
- PennyMac442 in FY2024
- Nationstar Mortgage (Mr. Cooper)343 in FY2024
- HSBC Bank USA274 in FY2024
- NewRez (Shellpoint)2613 in FY2024
- Planet Home Lending2613 in FY2024
- Fannie Mae1822 in FY2024
- Wilmington Savings Fund Society1715 in FY2024
- Carrington Mortgage Services150 in FY2024
- Truist Bank138 in FY2024
All plaintiff groups
- Wilmington Trust1210 in FY2024
- San Mateo IG LLC110 in FY2024
- Bank of New York Mellon98 in FY2024
- CitiMortgage92 in FY2024
- Freedom Mortgage92 in FY2024
- Plaza Home Mortgage91 in FY2024
- Freddie Mac83 in FY2024
- Computershare Trust70 in FY2024
- RAD Diversified REIT70 in FY2024
- Citibank62 in FY2024
- MidFirst Bank61 in FY2024
- Servbank53 in FY2024
- PNC Bank52 in FY2024
- Banco Popular de Puerto Rico51 in FY2024
- MetLife51 in FY2024
- M&T Bank41 in FY2024
- Brighthouse Life Insurance40 in FY2024
- Bank of America33 in FY2024
- Selene Finance24 in FY2024
- JPMorgan Chase Bank23 in FY2024
- loanDepot21 in FY2024
- Rocket Mortgage11 in FY2024
- Select Portfolio Servicing02 in FY2024
- SN Servicing00 in FY2024
- U.S. government (all agencies)12343 in FY2024
- All other plaintiffs (individuals and other entities)1,090918 in FY2024
FY2025 = October 1, 2024 to September 30, 2025, the federal fiscal year used by the courts.
Who Brings Foreclosure Cases in Federal Court
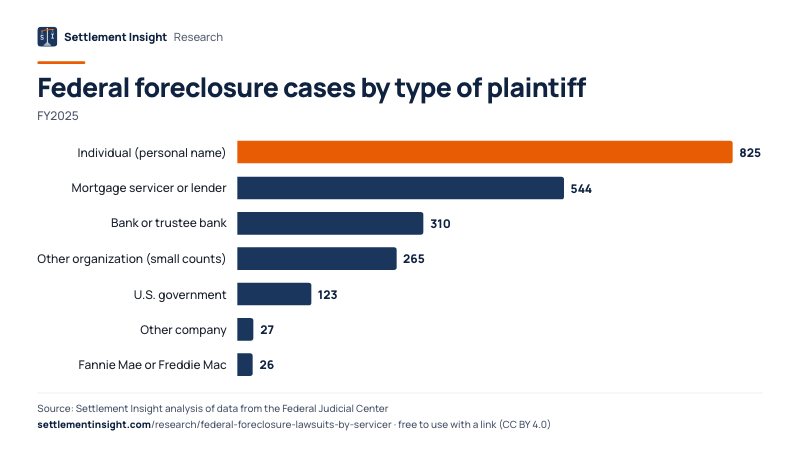
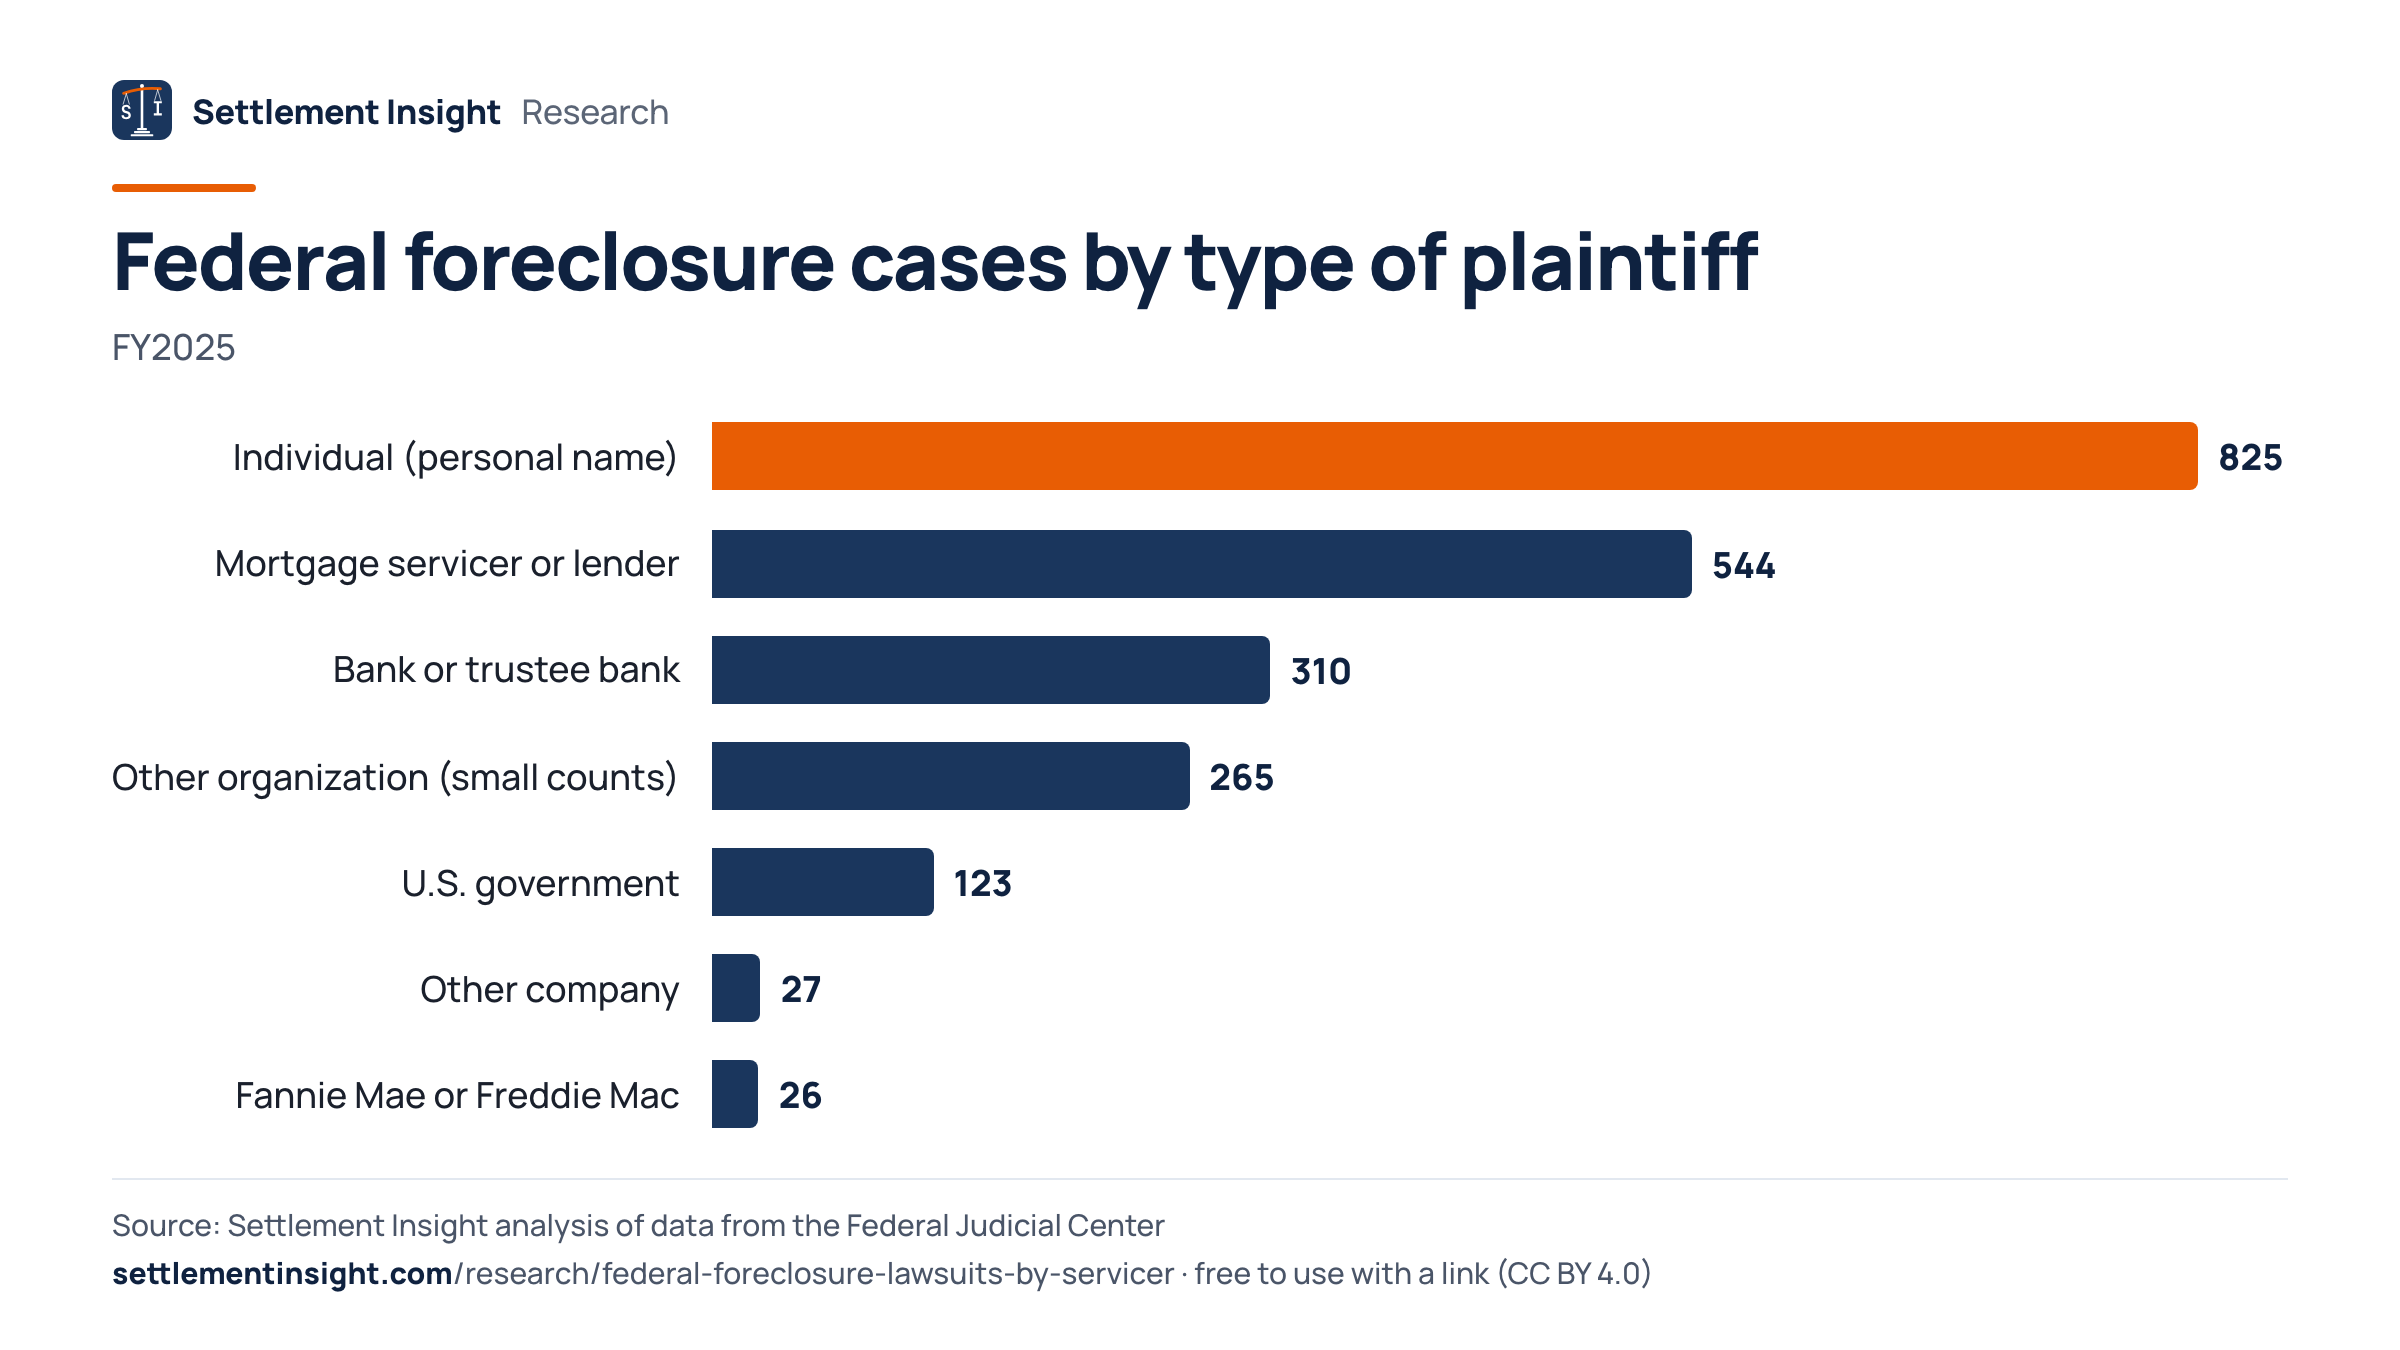
Servicers and lenders identified by name accounted for at least 25.7% of FY2025 federal foreclosure cases. Plaintiffs listed under a personal name accounted for an estimated 825 cases.
Mortgage servicers and lenders were the largest group of company plaintiffs we identified, with at least 544 cases; banks and trustee banks followed with 310.
Not every foreclosure case is brought by a lender. The courts’ code for these cases also covers suits that try to stop a foreclosure, and 825 FY2025 cases (38.9%) list a person rather than an organization as first plaintiff. We do not name these individuals. The split between persons and organizations is based on the form of the name and is an estimate.
Fannie Mae and Freddie Mac were the named plaintiff in 26 cases; the U.S. government, including the Department of Agriculture, in 123.
Federal foreclosure cases by type of plaintiff
| Plaintiff type | FY2025 | FY2024 | Share |
|---|---|---|---|
| Individual (personal name) | 825 | 686 | 38.9% |
| Mortgage servicer or lender | 544 | 59 | 25.7% |
| Bank or trustee bank | 310 | 171 | 14.6% |
| Other organization (small counts) | 265 | 232 | 12.5% |
| U.S. government | 123 | 43 | 5.8% |
| Other company | 27 | 1 | 1.3% |
| Fannie Mae or Freddie Mac | 26 | 25 | 1.2% |
How Federal Foreclosure Cases Changed Since 2005
Federal foreclosure cases rose 74.2% from 1,217 in FY2024 to 2,120 in FY2025.
After a low of 1,005 cases in FY2021, FY2025 brought the most federal foreclosure cases since fiscal 2019, but far fewer than the 8,107 of FY2012.
The series counts all foreclosure cases commenced in U.S. district courts, including cases removed from state courts (697 in FY2025) and reopened cases. Most private foreclosure cases reach federal court through diversity of citizenship, when the lender and the borrower are from different states (1,057 in FY2025).
Federal foreclosure cases by fiscal year
- 20052,992227 removed from state court
- 20062,616162 removed from state court
- 20072,949167 removed from state court
- 20082,132359 removed from state court
- 20093,0981,419 removed from state court
- 20104,2481,752 removed from state court
- 20117,2223,300 removed from state court
- 20128,1073,491 removed from state court
- 20136,2362,620 removed from state court
- 20143,9231,882 removed from state court
- 20154,2451,834 removed from state court
- 20164,7981,528 removed from state court
- 20173,9631,357 removed from state court
- 20183,0321,139 removed from state court
- 20192,9631,066 removed from state court
All fiscal years
- 20201,805664 removed from state court
- 20211,005299 removed from state court
- 20221,280544 removed from state court
- 20231,348517 removed from state court
- 20241,217511 removed from state court
- 20252,120697 removed from state court
Where Federal Foreclosure Cases Were Filed
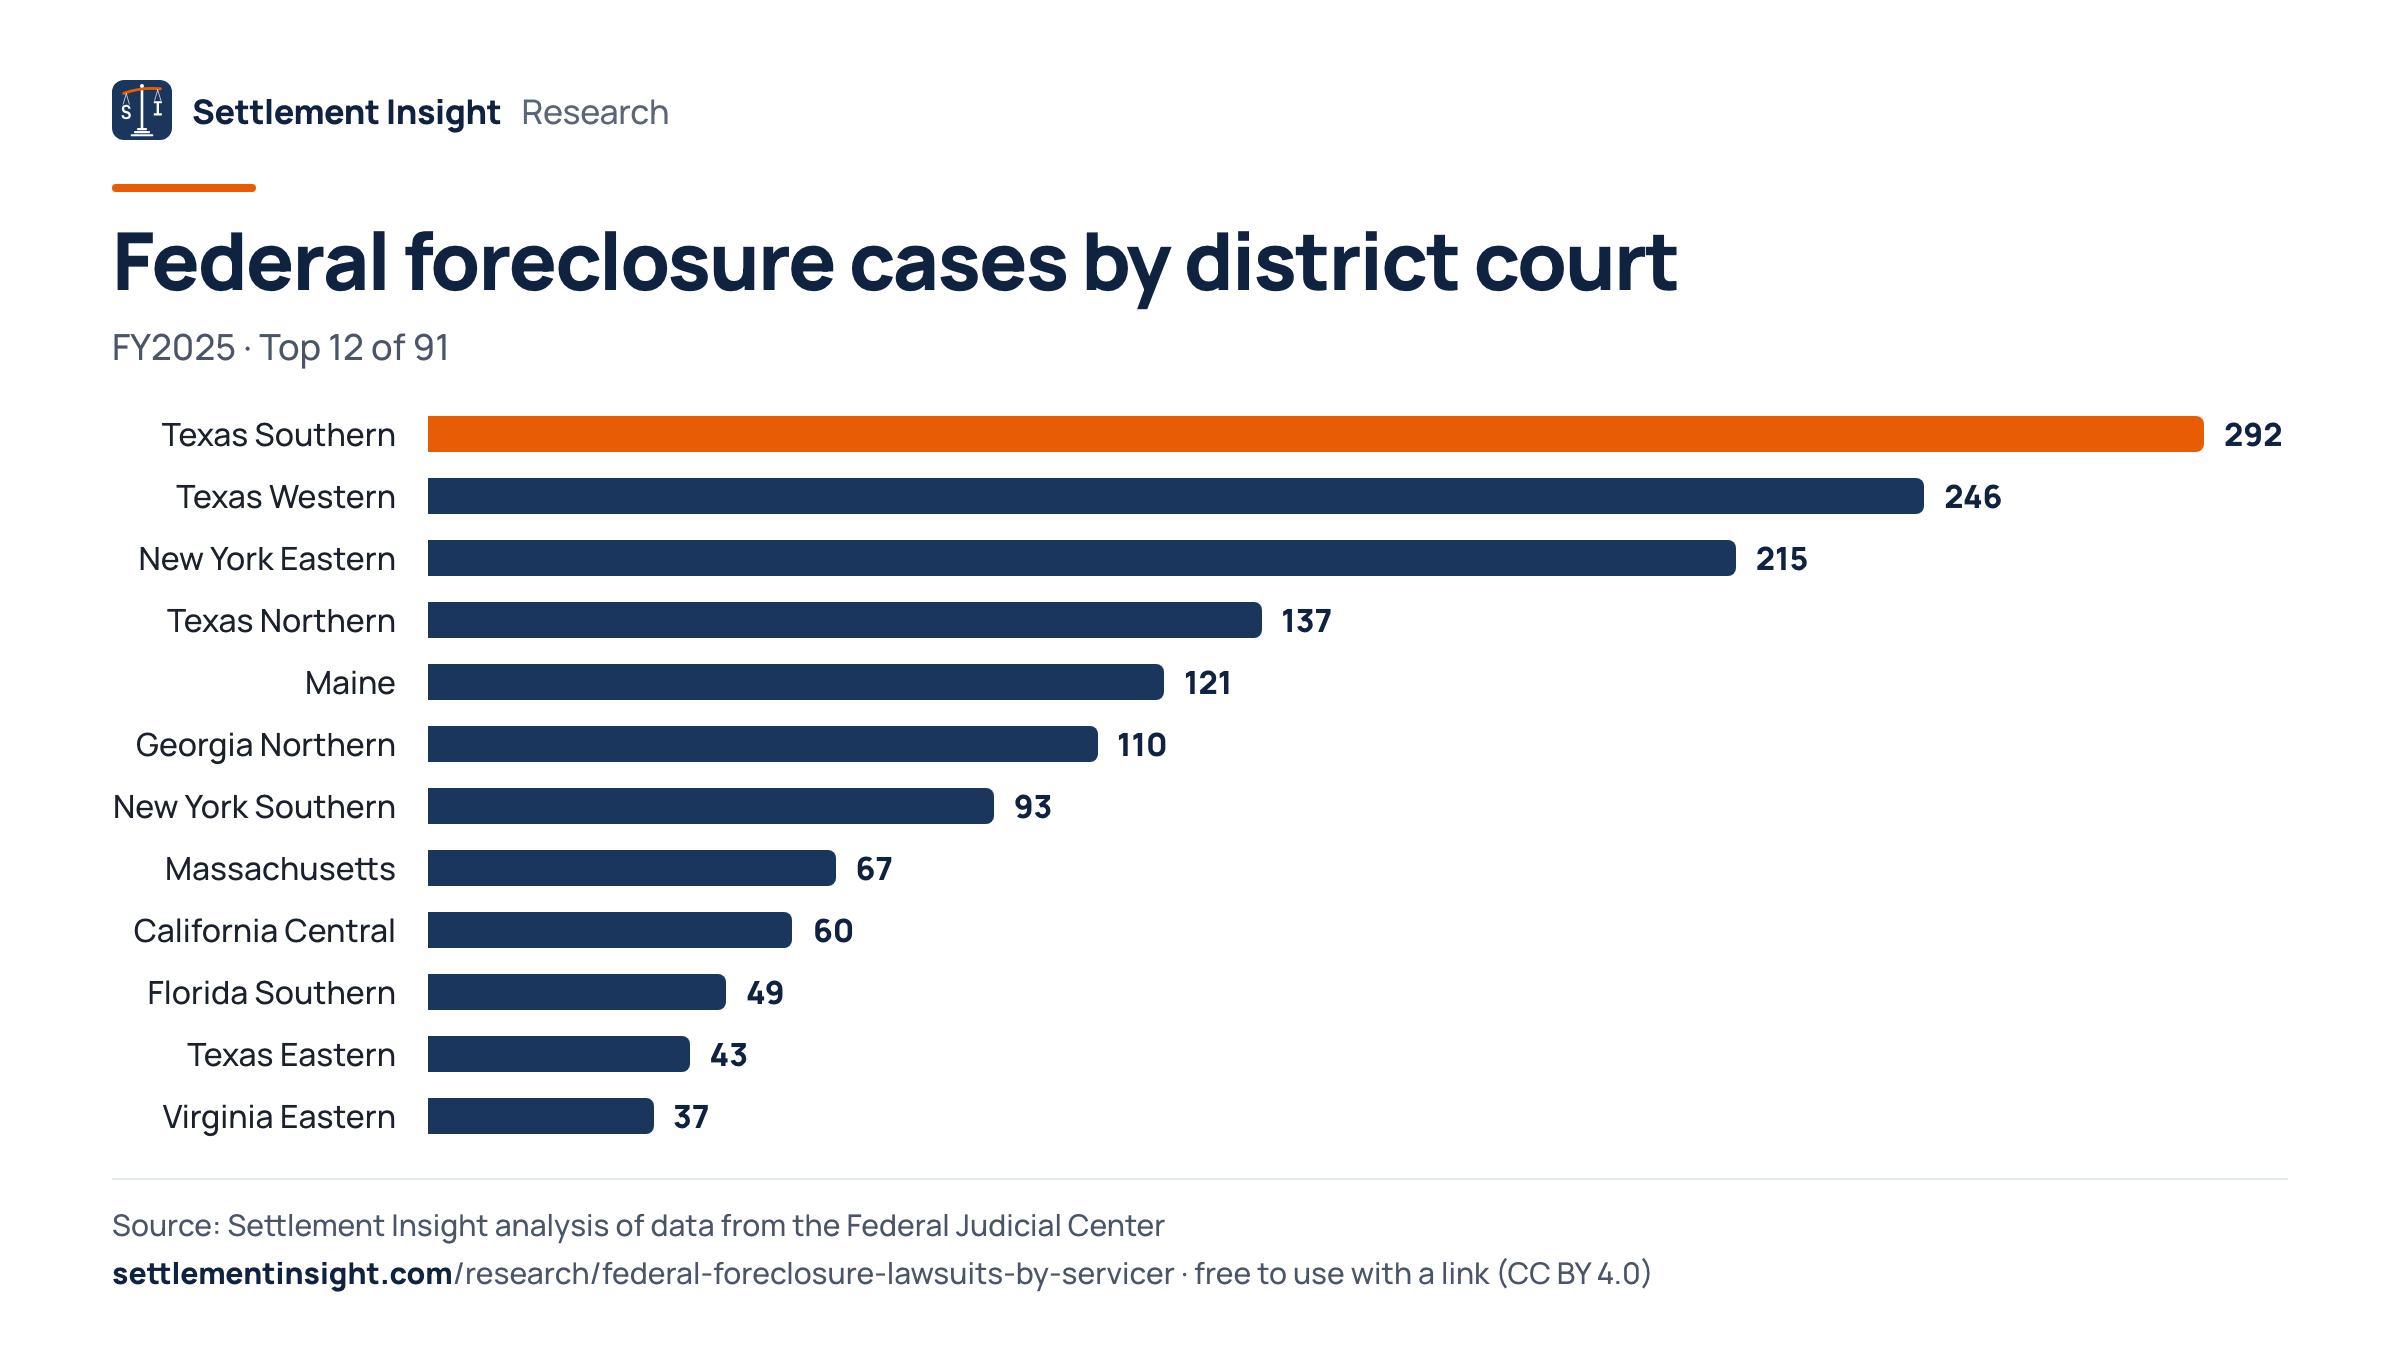
The Southern District of Texas received 292 foreclosure cases in FY2025, more than any other federal district.
Texas districts received 718 of 2,120 federal foreclosure cases in FY2025, outside Texas, the Eastern District of New York received the most.
The column “Top four” counts cases in which Lakeview, PHH, AmeriHome or PennyMac was the named plaintiff. Federal foreclosure cases were filed in 87 districts in FY2025. Counts are not adjusted for the number of mortgages or homes in each district.
Federal foreclosure cases by district court
| District | FY2025 | FY2024 | Top four |
|---|---|---|---|
| Texas Southern | 292 | 168 | 71 |
| Texas Western | 246 | 85 | 89 |
| New York Eastern | 215 | 68 | 63 |
| Texas Northern | 137 | 85 | 39 |
| Maine | 121 | 56 | 5 |
| Georgia Northern | 110 | 87 | 3 |
| New York Southern | 93 | 36 | 21 |
| Massachusetts | 67 | 39 | 18 |
| California Central | 60 | 45 | 0 |
| Florida Southern | 49 | 34 | 1 |
| Texas Eastern | 43 | 28 | 18 |
| Virginia Eastern | 37 | 22 | 11 |
| California Northern | 31 | 29 | 0 |
| New York Northern | 30 | 14 | 16 |
| California Eastern | 28 | 15 | 0 |
All districts
| District | FY2025 | FY2024 | Top four |
|---|---|---|---|
| Puerto Rico | 28 | 8 | 0 |
| Pennsylvania Eastern | 27 | 28 | 0 |
| Florida Middle | 27 | 26 | 1 |
| New York Western | 26 | 8 | 9 |
| Maryland | 24 | 14 | 0 |
| Alabama Northern | 20 | 13 | 1 |
| Illinois Northern | 19 | 17 | 1 |
| Virgin Islands | 19 | 13 | 0 |
| Michigan Eastern | 17 | 19 | 0 |
| New Jersey | 17 | 12 | 1 |
| Tennessee Western | 17 | 5 | 8 |
| Arizona | 15 | 10 | 0 |
| Virginia Western | 14 | 10 | 1 |
| Tennessee Eastern | 14 | 2 | 8 |
| New Mexico | 13 | 11 | 0 |
| District of Columbia | 12 | 5 | 0 |
| Nevada | 11 | 9 | 0 |
| Ohio Northern | 11 | 5 | 1 |
| Arkansas Eastern | 10 | 5 | 1 |
| Rhode Island | 9 | 14 | 0 |
| Alabama Middle | 9 | 3 | 0 |
| South Carolina | 9 | 3 | 0 |
| Ohio Southern | 9 | 1 | 1 |
| Hawaii | 8 | 16 | 0 |
| Connecticut | 8 | 11 | 0 |
| Mississippi Southern | 8 | 7 | 0 |
| Louisiana Eastern | 7 | 7 | 0 |
| Oklahoma Western | 7 | 6 | 0 |
| Tennessee Middle | 7 | 5 | 2 |
| North Carolina Eastern | 7 | 4 | 0 |
| Georgia Middle | 7 | 2 | 4 |
| Louisiana Middle | 7 | 1 | 1 |
| Oregon | 6 | 12 | 0 |
| Washington Western | 6 | 11 | 0 |
| New Hampshire | 6 | 3 | 1 |
| Illinois Central | 6 | 2 | 0 |
| Indiana Northern | 5 | 6 | 0 |
| California Southern | 5 | 4 | 0 |
| Louisiana Western | 5 | 3 | 0 |
| Michigan Western | 5 | 3 | 0 |
| Pennsylvania Western | 4 | 6 | 0 |
| Mississippi Northern | 4 | 4 | 0 |
| Arkansas Western | 4 | 3 | 2 |
| Indiana Southern | 4 | 1 | 0 |
| Washington Eastern | 4 | 1 | 0 |
| Delaware | 3 | 4 | 0 |
| Pennsylvania Middle | 3 | 2 | 0 |
| Wisconsin Eastern | 3 | 2 | 0 |
| Minnesota | 3 | 1 | 0 |
| Idaho | 3 | 0 | 0 |
| Kentucky Western | 3 | 0 | 0 |
| West Virginia Southern | 3 | 0 | 0 |
| Colorado | 2 | 6 | 0 |
| Illinois Southern | 2 | 4 | 1 |
| Utah | 2 | 4 | 0 |
| Missouri Eastern | 2 | 2 | 0 |
| North Carolina Western | 2 | 1 | 0 |
| Vermont | 2 | 1 | 0 |
| Wyoming | 2 | 1 | 0 |
| Georgia Southern | 2 | 0 | 0 |
| Iowa Northern | 2 | 0 | 0 |
| Kentucky Eastern | 2 | 0 | 1 |
| Montana | 2 | 0 | 0 |
| North Carolina Middle | 2 | 0 | 0 |
| South Dakota | 2 | 0 | 0 |
| Florida Northern | 1 | 4 | 0 |
| Kansas | 1 | 3 | 0 |
| Alaska | 1 | 2 | 0 |
| North Dakota | 1 | 2 | 0 |
| Alabama Southern | 1 | 1 | 0 |
| Iowa Southern | 1 | 1 | 0 |
| Wisconsin Western | 1 | 1 | 0 |
| Nebraska | 0 | 2 | 0 |
| Missouri Western | 0 | 1 | 0 |
| Oklahoma Eastern | 0 | 1 | 0 |
| West Virginia Northern | 0 | 1 | 0 |
Which Servicers Are Sued Over Foreclosures
Some companies appear far more often as defendants than as plaintiffs in federal foreclosure cases.
PHH Mortgage was the first-listed defendant in 70 FY2025 foreclosure cases; Select Portfolio Servicing and NewRez also appear mostly on the defense side.
When a homeowner sues to stop or challenge a foreclosure, the servicer or the trustee is usually the defendant. The table compares how often each company group was the first-listed plaintiff and the first-listed defendant in FY2025. Only the first-listed party is recorded, so companies named further down the caption are not counted.
Company groups as plaintiff and as defendant, FY2025
| Company | Plaintiff | Defendant |
|---|---|---|
| U.S. Bank | 87 | 71 |
| PHH Mortgage | 113 | 70 |
| NewRez (Shellpoint) | 26 | 48 |
| Select Portfolio Servicing | 0 | 44 |
| Nationstar Mortgage (Mr. Cooper) | 34 | 40 |
| Deutsche Bank | 65 | 33 |
| Freedom Mortgage | 9 | 26 |
| Wells Fargo Bank | 48 | 18 |
| Wilmington Savings Fund Society | 17 | 16 |
| Carrington Mortgage Services | 15 | 16 |
| PennyMac | 44 | 15 |
| Bank of New York Mellon | 9 | 9 |
All company groups
| Company | Plaintiff | Defendant |
|---|---|---|
| JPMorgan Chase Bank | 2 | 9 |
| SN Servicing | 0 | 9 |
| Lakeview Loan Servicing | 187 | 8 |
| Bank of America | 3 | 8 |
| Selene Finance | 2 | 8 |
| Fannie Mae | 18 | 6 |
| Rocket Mortgage | 1 | 5 |
| MidFirst Bank | 6 | 4 |
| HSBC Bank USA | 27 | 3 |
| Planet Home Lending | 26 | 3 |
| Truist Bank | 13 | 3 |
| loanDepot | 2 | 3 |
| AmeriHome Mortgage | 56 | 2 |
| Citibank | 6 | 2 |
| Servbank | 5 | 2 |
| PNC Bank | 5 | 2 |
| Wilmington Trust | 12 | 1 |
| CitiMortgage | 9 | 1 |
| Freddie Mac | 8 | 1 |
| Banco Popular de Puerto Rico | 5 | 1 |
| MetLife | 5 | 1 |
| San Mateo IG LLC | 11 | 0 |
| Plaza Home Mortgage | 9 | 0 |
| Computershare Trust | 7 | 0 |
| RAD Diversified REIT | 7 | 0 |
| M&T Bank | 4 | 0 |
| Brighthouse Life Insurance | 4 | 0 |
| U.S. government (all agencies) | 123 | 0 |
| All other plaintiffs (individuals and other entities) | 1,090 | 0 |
Download the Data and Cite This Study
Every table as a CSV file and in one Excel workbook, a short PDF summary and every chart as an image, free to reuse with attribution (CC BY 4.0).
- Federal foreclosure filings by district court, FY2025 vs. FY2024Foreclosure filings per U.S. district court in fiscal 2025 and 2024, with the number filed in the name of Lakeview, PHH, AmeriHome or PennyMac in fiscal 2025. · 91 rows · CSV, 3 KB
- Federal foreclosure filings by fiscal year, FY2005–FY2025Foreclosure filings in U.S. district courts per federal fiscal year by basis of jurisdiction and number removed from state court. · 21 rows · CSV, 1 KB
- Federal foreclosure filings by type of plaintiff, FY2025 vs. FY2024Foreclosure filings in U.S. district courts by type of first-listed plaintiff (servicers and lenders, banks and trustee banks, Fannie Mae and Freddie Mac, other named companies, U.S. government, other organizations, and individuals identified by the form of the name). · 7 rows · CSV, 1 KB
- Federal foreclosure filings by named plaintiff, FY2025 vs. FY2024Foreclosure filings (nature of suit 220) in U.S. district courts by first-listed plaintiff, grouped by company name, with fiscal 2024 for comparison and the number of filings in which the company was the first-listed defendant instead. · 41 rows · CSV, 3 KB
- All tables in one Excel workbookOne sheet per table plus an About sheet with sources, method and citation · Excel (.xlsx), 17 KB
- Summary to print or forward (3 pages)Short answer, key figures, main chart, findings, method and citation · PDF, 233 KB
Charts for your story
Federal foreclosure cases by named plaintiff, FY2025
Embed this chart
Federal foreclosure cases by type of plaintiff
Embed this chart
Federal foreclosure cases by fiscal year
Embed this chart
Federal foreclosure cases by district court
Embed this chart
How to cite
Goldberg, L. (2026). Federal Foreclosure Lawsuits by Servicer — Cases by Named Plaintiff, District and Fiscal Year (FY2005–FY2025) [Data set]. Settlement Insight. https://settlementinsight.com/research/federal-foreclosure-lawsuits-by-servicer
BibTeX
@dataset{goldberg_2026_federal_foreclosure_lawsuits_by_servicer,
  author    = {Goldberg, Leonard},
  title     = {Federal Foreclosure Lawsuits by Servicer --- Cases by Named Plaintiff, District and Fiscal Year (FY2005--FY2025)},
  year      = {2026},
  publisher = {Settlement Insight},
  url       = {https://settlementinsight.com/research/federal-foreclosure-lawsuits-by-servicer}
}How We Measured
Checked against published figures
- Foreclosure cases commenced in U.S. district courts, 12 months ending Sep 30, 2025 (FY2025): published 2,126, our count 2,120 (0.28% apart).Table C-2. U.S. District Courts—Civil Cases Commenced, by Basis of Jurisdiction and Nature of Suit, During the 12-Month Periods Ending September 30, 2024 and 2025
- Foreclosure cases commenced in U.S. district courts, 12 months ending Sep 30, 2024 (FY2024): published 1,215, our count 1,217 (0.16% apart).Table C-2. U.S. District Courts—Civil Cases Commenced, by Basis of Jurisdiction and Nature of Suit, During the 12-Month Periods Ending September 30, 2024 and 2025
- FY2025 foreclosure cases with diversity of citizenship jurisdiction: published 1,062, our count 1,057 (0.47% apart).Table C-2. U.S. District Courts—Civil Cases Commenced, by Basis of Jurisdiction and Nature of Suit, During the 12-Month Periods Ending September 30, 2024 and 2025
- FY2025 foreclosure cases with the United States as plaintiff: published 123, our count 123 (exact match).Table C-2. U.S. District Courts—Civil Cases Commenced, by Basis of Jurisdiction and Nature of Suit, During the 12-Month Periods Ending September 30, 2024 and 2025
Full method and limits of the data
We selected all records with nature of suit code 220 (“Foreclosure”) and a filing date from October 1, 2004 to September 30, 2025, and assigned each record to a federal fiscal year (October to September). Each record is one case commenced, as in the judiciary’s own statistics: original filings, removals from state court, reopened cases and transfers. In FY2025, 2,120 records belong to 2,107 distinct docket numbers; 13 records are reopenings or other second entries of the same case.
For fiscal 2024 and 2025 we grouped the first-listed plaintiff by company name, combining spelling variants and affiliated entities that carry the same brand (for example PennyMac Loan Services and PennyMac Mortgage). Cases with the United States as plaintiff form one group. All remaining plaintiffs, including every private individual, are reported only in aggregate.
To check the data, we recomputed the judiciary’s published total. Table C-2 of the Judicial Business statistics lists 2,126 foreclosure cases commenced in the 12 months ending September 30, 2025, and 1,215 a year earlier; our count of 2,120 is 0.28% lower, and our FY2024 count is 1,217. The split by jurisdiction (U.S. plaintiff, U.S. defendant, federal question, diversity) also matches within a few cases.
What this data cannot tell you
- The named plaintiff is the party in whose name the case is filed. That can be the servicer, the owner of the loan, or a bank acting as trustee for a securitization trust. The data do not show which company services a trust’s loan or whether a subservicer handles the case for the named company.
- The ranking counts cases, not loans or homes, and is not adjusted for the size of each company’s mortgage portfolio. A company with more loans in default would be expected to file more cases.
- The courts’ official description of code 220 is an “action to enjoin foreclosure on real property by mortgage lender.” In practice the code is used both for lender foreclosure suits and for suits by borrowers; the split between persons and organizations in the residual group is based on the form of the name and is approximate.
- Federal court is only one venue. Foreclosures decided in state courts or carried out without a court are not in these data, so the counts do not measure the number of foreclosures.
- The IDB stores party names in shortened form and only for the first-listed plaintiff and defendant. Unusual spellings of a company name may be missed by our grouping and then fall into the residual group.
- Courts can correct or add records after the fact. FY2025 ended more than a year before this analysis, but a later FJC release may change individual counts slightly.
Frequently Asked Questions
Which mortgage company filed the most foreclosure lawsuits in federal court in 2025?
Lakeview Loan Servicing was the named plaintiff in 187 federal foreclosure cases in fiscal year 2025, more than any other party. PHH Mortgage followed with 113.
How many foreclosure lawsuits were filed in federal court in 2025?
U.S. district courts received 2,120 foreclosure cases in fiscal year 2025 by our count of the FJC data; the judiciary’s own table lists 2,126. That is 74.2% more than our FY2024 count of 1,217.
Why did federal foreclosure cases increase in 2025?
The data do not record reasons. They show that four servicers, Lakeview, PHH, AmeriHome and PennyMac, went from 13 cases to 400, which accounts for 42.9% of the rise.
How many foreclosure lawsuits did PennyMac file in federal court?
PennyMac entities were the named plaintiff in 44 federal foreclosure cases in fiscal year 2025, up from 2 in FY2024, which placed PennyMac among the top ten plaintiffs. PennyMac was also the first-listed defendant in 15 cases.
What is a judicial foreclosure in federal court?
In a judicial foreclosure the lender asks a court to order the sale of the property. A case can be heard in federal court when the parties are from different states (diversity of citizenship, 1,057 of the FY2025 cases), when the United States is a party, or when it raises a federal question; a case filed in state court can be removed to federal court on the same grounds.
Are federal foreclosure cases the same as foreclosure rates?
No. These counts cover only cases in U.S. district courts. Foreclosures handled in state courts or carried out without a court are not included, so the numbers show federal court activity, not how many homes were foreclosed.
Sources
- Integrated Database (IDB) — civil cases — Federal Judicial Center
- Table C-2. U.S. District Courts—Civil Cases Commenced, by Basis of Jurisdiction and Nature of Suit, 12-Month Periods Ending September 30, 2024 and 2025 — Administrative Office of the U.S. Courts
- Civil Nature of Suit Code Descriptions — Administrative Office of the U.S. Courts
- Independent analysis. Settlement Insight is not a law firm and not affiliated with any agency named here. Analysis by Leonard Goldberg, Editor. How we work: methodology, our data.
More Research and Data
Other studies from our database of public legal records — each with free CSV downloads.
Related research
Latest studies
- Credit Bureau Lawsuits38.7% of FY2025 federal consumer credit suits named a big-three credit bureau first
- How Long MDLs LastFederal MDLs closed since 2023 lasted a median of 5.9 years
- Immigration mandamus lawsuit outcomes71.7% of Other Immigration Actions suits closed in FY2025 were voluntarily dismissed
- Most-cited mines, FY2025No 7 Mine in Alabama drew 928 MSHA citations and orders in FY2025, more than any other U.S. mine