Meta, Uber, Roblox: How Many Product Liability Lawsuits Target Tech Platforms
Original analysis of 543,213 records from the Federal Judicial Center, FY2016–FY2026 (Oct 2015–Jun 2026). Published October 21, 2026.
We counted 543,213 federal product liability cases (nature of suit 365) filed from October 2015 to June 2026 and checked how many name Meta, Uber, Roblox, Snap, TikTok, Google/YouTube, Discord or Character.AI as the first defendant.
What the federal court records show
From October 2025 through June 2026, 25.5% of new federal product liability lawsuits outside the health care/pharma and asbestos categories (2,183 of 8,548) named Meta, Uber, Roblox or another of eight tech platforms as the first defendant, up from 11.5% in fiscal 2025 and 3.7% in fiscal 2024. The share rose partly because other filings fell: platform cases averaged 243 a month, against 219 in fiscal 2025, while all product liability filings dropped from 1,906 to 950 a month as filings naming 3M, mostly in the firefighting-foam (AFFF) and combat earplug MDLs, fell off.
- 26%Non-pharma suits naming a tech platform, Oct 2025–Jun 2026
- 11%Same share in fiscal 2025
- 4.81KTech-platform cases, Oct 2024–Jun 2026
More than one in four
In the first nine months of fiscal 2026, tech platforms were the first-named defendant in 2,183 of 8,548 new product liability cases, or one in every 3.9.
Uber and Meta account for most
Uber was named first in 1,071 cases (12.5% of all product liability filings) and Meta in 940 (11.0%) from October 2025 to June 2026.
Roblox cases multiplied
Suits naming Roblox first rose from 36 in all of fiscal 2025 to 135 in the first nine months of fiscal 2026.
A shrinking denominator
3M was the first-named defendant in 47.5% of fiscal 2025 product liability filings but only 8.2% in fiscal 2026 to date, so the platform share grew faster than platform filings did.
Outside direct MDL filings
Leaving out cases filed directly into a multidistrict litigation, the platform share was 10.1% in fiscal 2025 and 21.2% in fiscal 2026 to date.
Almost all in one court
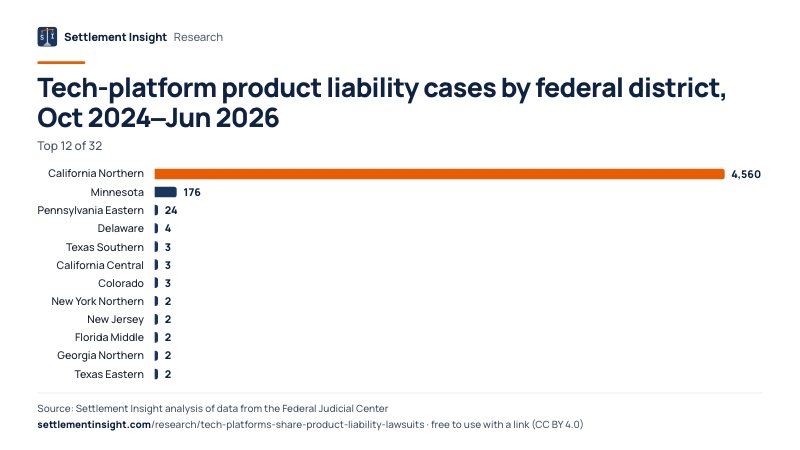
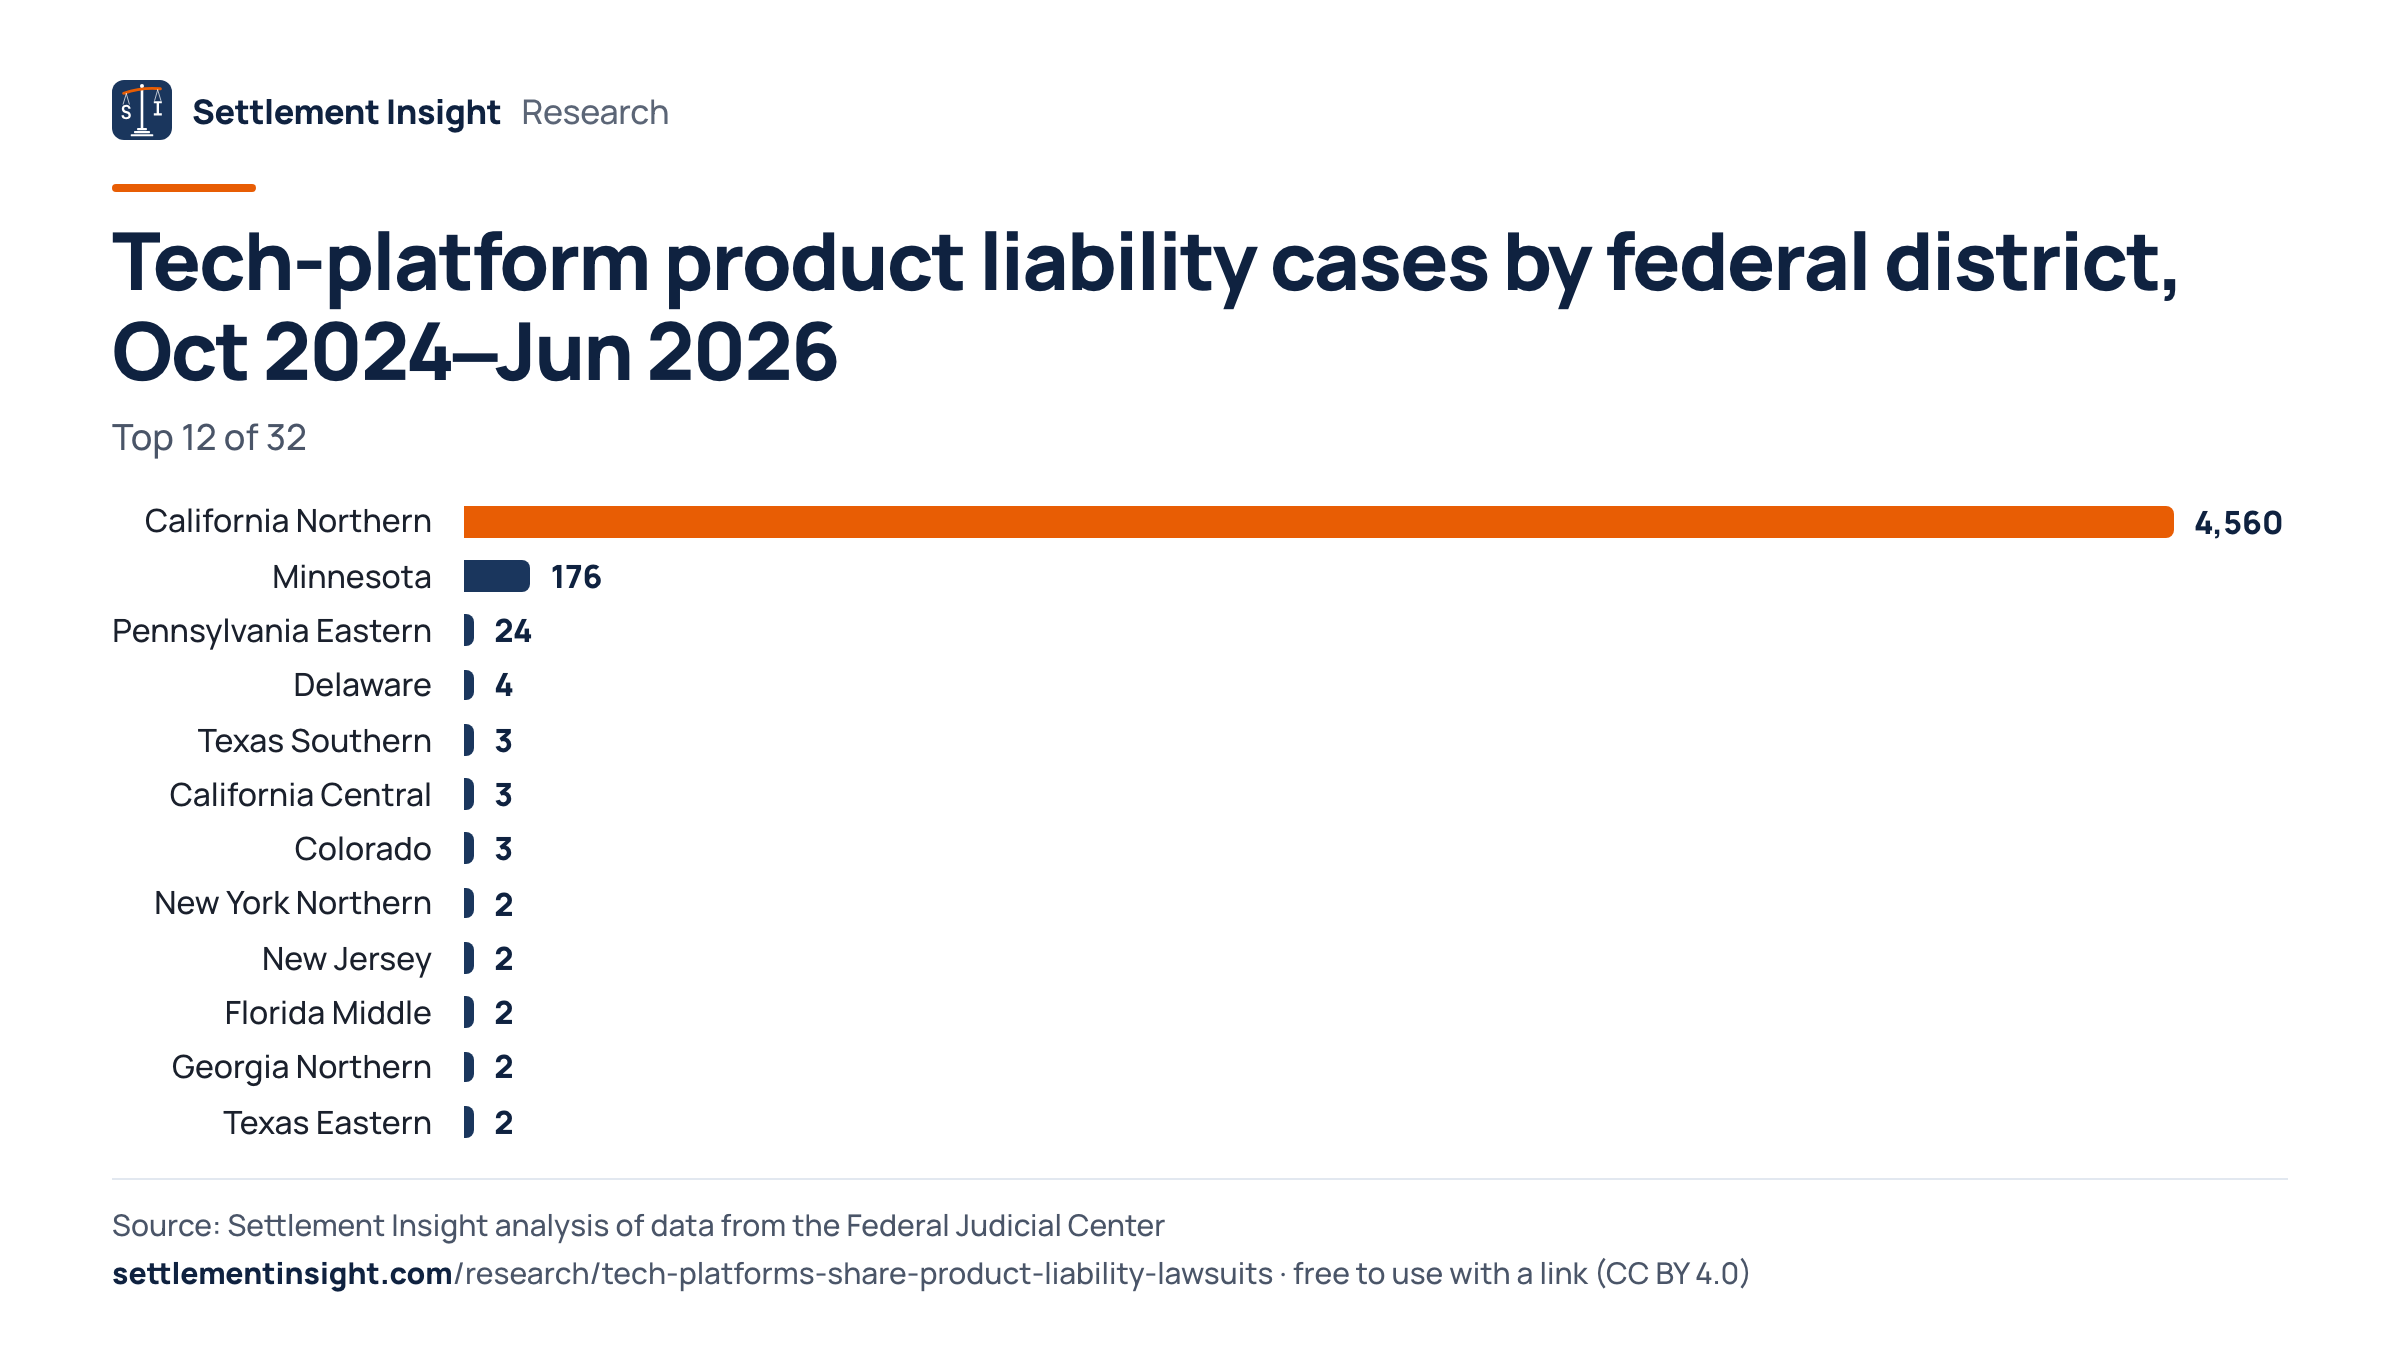
Of the 4,807 platform cases filed from October 2024 to June 2026, 94.9% were docketed in the Northern District of California, home to the Meta, Uber and Roblox MDLs.
What Share of Product Liability Lawsuits Target Tech Platforms
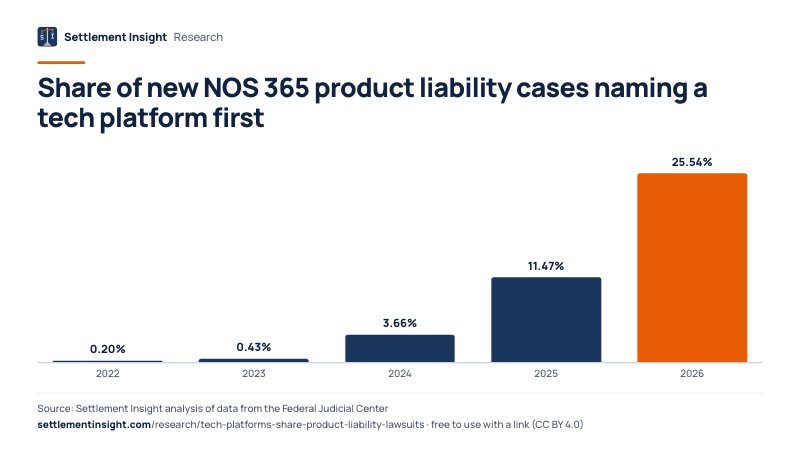
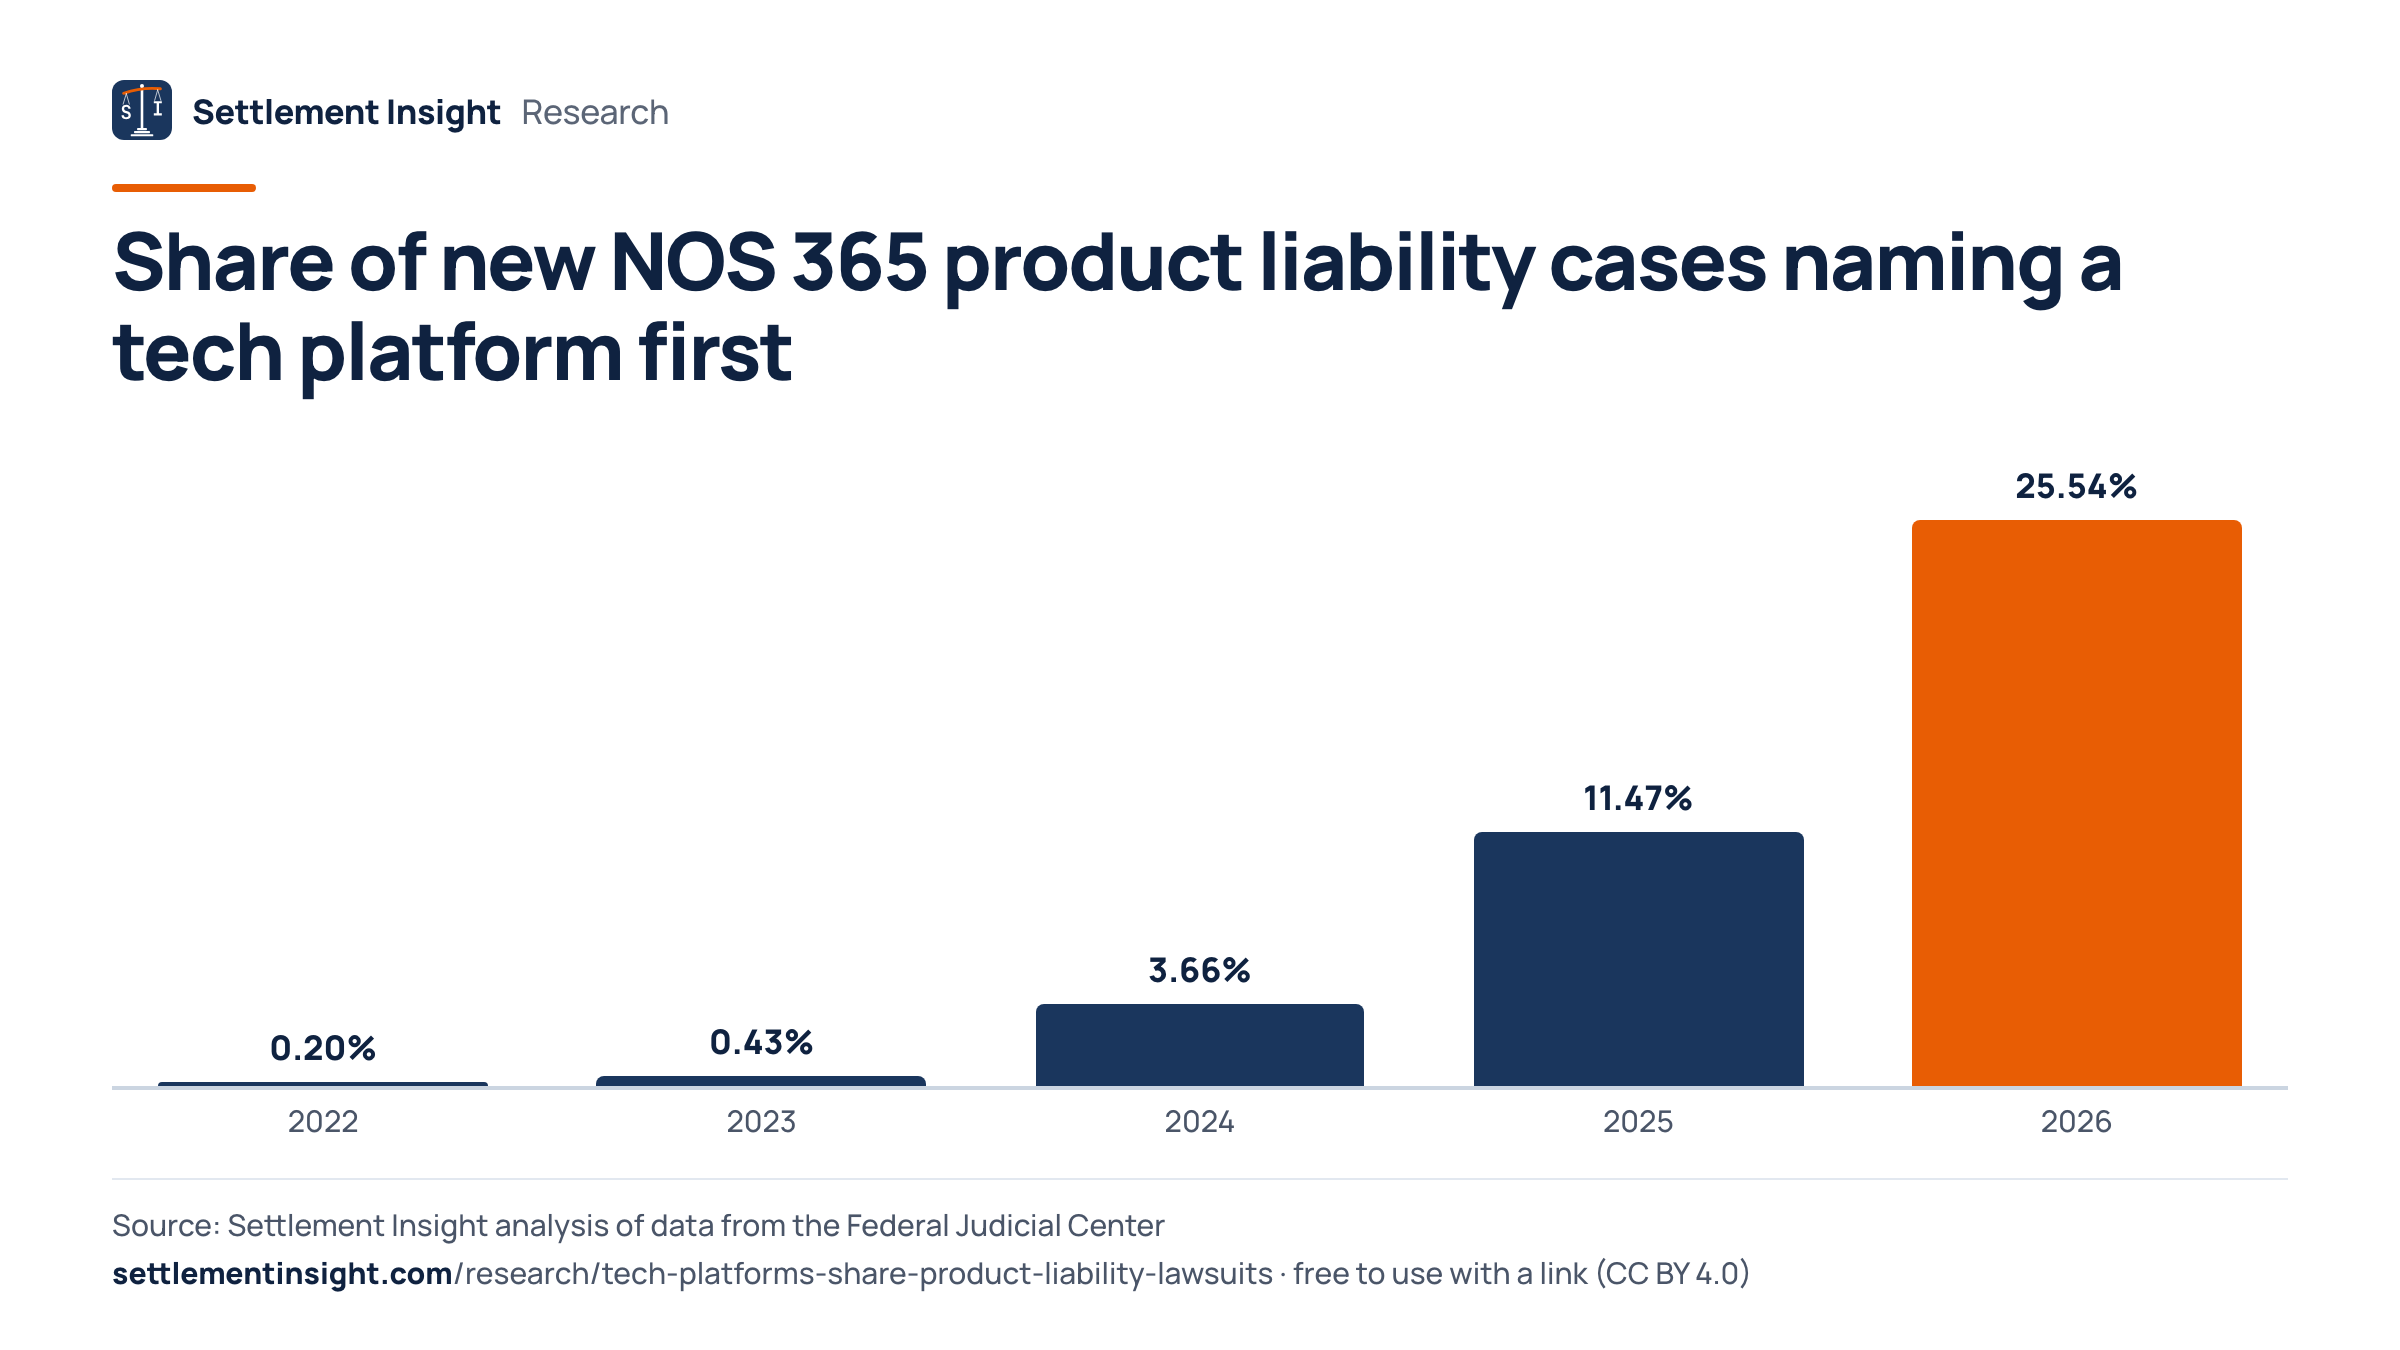
The share of new federal product liability suits naming a tech platform first stayed below one percent through fiscal 2023 and has risen in every fiscal year since fiscal 2022.
The share was 0.20% in fiscal 2022, 0.4% in fiscal 2023, 3.7% in fiscal 2024, 11.5% in fiscal 2025 and 25.5% from October 2025 to June 2026.
From fiscal 2016 through fiscal 2021 we found only 12 product liability cases naming one of the eight platforms first. Filings against Meta began to rise in fiscal 2022, and Uber cases followed from fiscal 2023. In fiscal 2024, 1,331 cases named a platform first; in fiscal 2025, 2,624.
Two forces move the share. Platform filings grew, from 219 a month in fiscal 2025 to 243 a month from October 2025 to June 2026. At the same time all other product liability filings fell sharply: 3M, sued mainly in MDL No. 2885 (combat earplugs) and MDL No. 2873 (firefighting foam) and the first-named defendant in 74.9% of fiscal 2024 filings, accounted for 8.2% in fiscal 2026 to date. Measured against filings that do not name 3M first, the platform share was 21.9% in fiscal 2025 and 27.8% in fiscal 2026 to date.
Share of new NOS 365 product liability cases naming a tech platform first
- FY20220.20%87 of 43,936 cases
- FY20230.43%281 of 65,949 cases
- FY20243.66%1,331 of 36,407 cases
- FY202511.47%2,624 of 22,876 cases
- FY202625.54%2,183 of 8,548 cases
Federal fiscal years run October to September. FY2026 covers October 2025 to June 2026 only, the last month in the current FJC file.
How Many Lawsuits Against Meta, Uber and Roblox
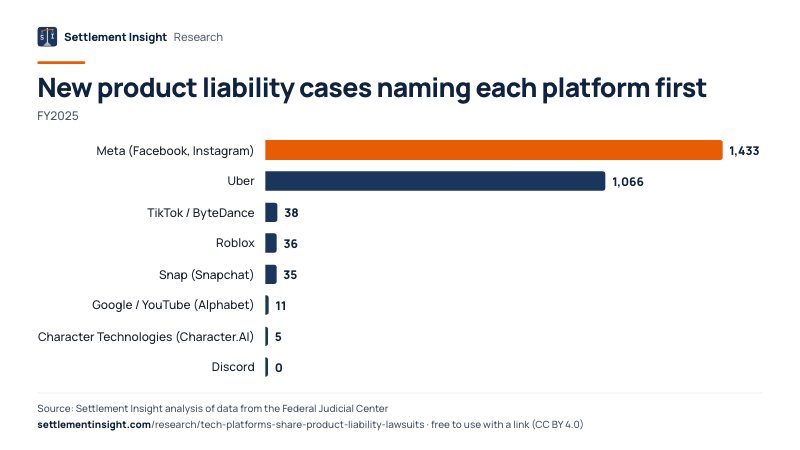
Two companies account for most platform cases: Uber, in suits over passenger sexual assaults, and Meta, in the social media adolescent addiction litigation.
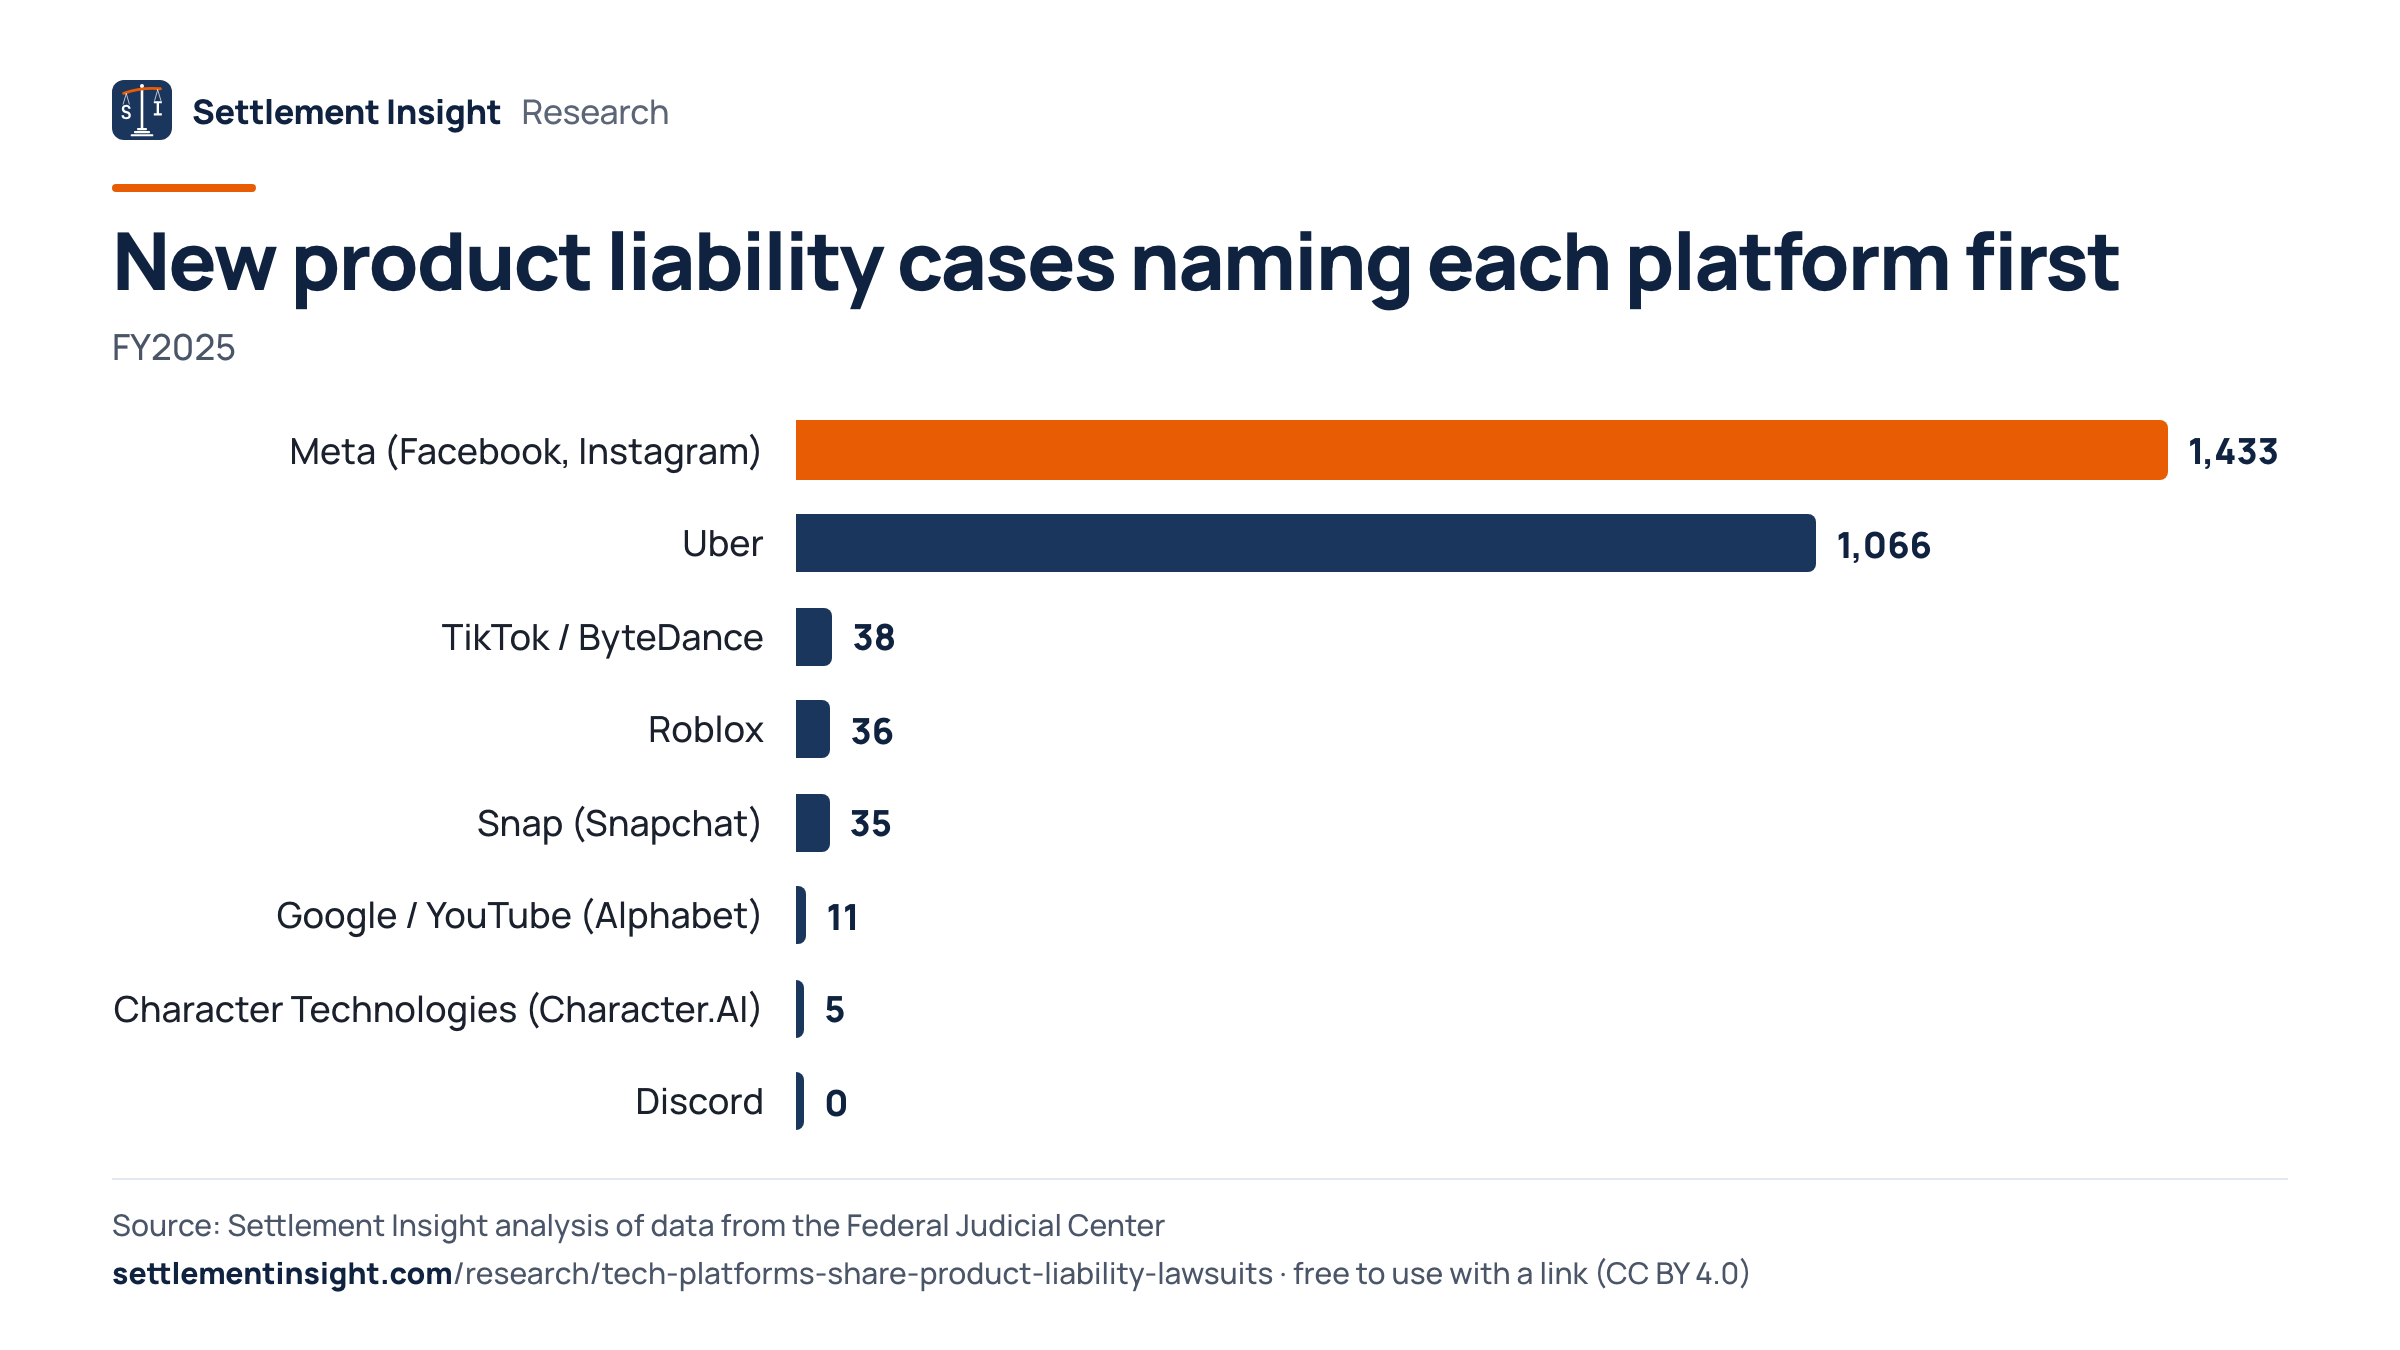
From October 2024 to June 2026, 2,137 new product liability cases named Uber first, 2,373 named Meta first and 171 named Roblox first.
Most of these cases sit in multidistrict litigations (MDLs) in the Northern District of California. The Judicial Panel on Multidistrict Litigation listed 3,940 pending actions in the Uber passenger sexual assault MDL, 2,893 in the social media adolescent addiction MDL and 170 in the Roblox child sexual exploitation MDL on July 1, 2026. Those MDL counts include cases filed before our period, so they are not comparable one for one with the filings counted here.
Snap, TikTok/ByteDance, Google/YouTube, Discord and Character Technologies appear less often as the first defendant. In social media cases they are frequently named alongside Meta; the court data record only the first name on the complaint, so those cases count once, under Meta.
New product liability cases naming each platform first
| Platform | FY2025 | FY2026 YTD | Total |
|---|---|---|---|
| Meta (Facebook, Instagram) | 1,433 | 940 | 2,373 |
| Uber | 1,066 | 1,071 | 2,137 |
| Roblox | 36 | 135 | 171 |
| TikTok / ByteDance | 38 | 16 | 54 |
| Snap (Snapchat) | 35 | 11 | 46 |
| Google / YouTube (Alphabet) | 11 | 8 | 19 |
| Character Technologies (Character.AI) | 5 | 1 | 6 |
| Discord | 0 | 1 | 1 |
FY2026 YTD means October 2025 to June 2026.
Are Lawsuits Against Tech Platforms Still Rising
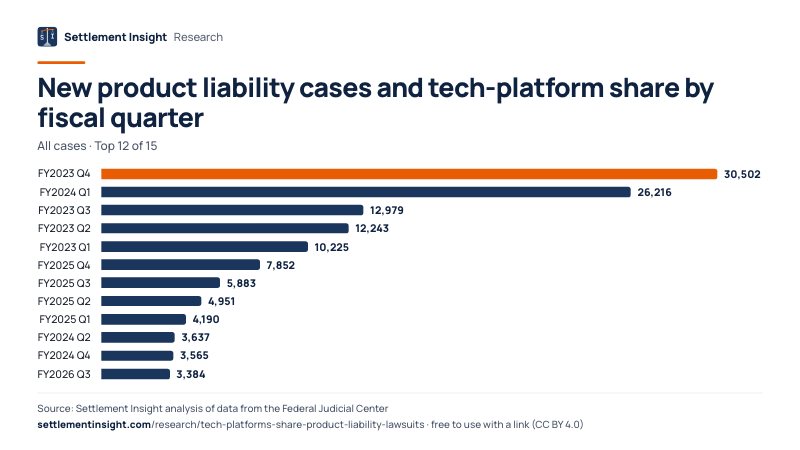
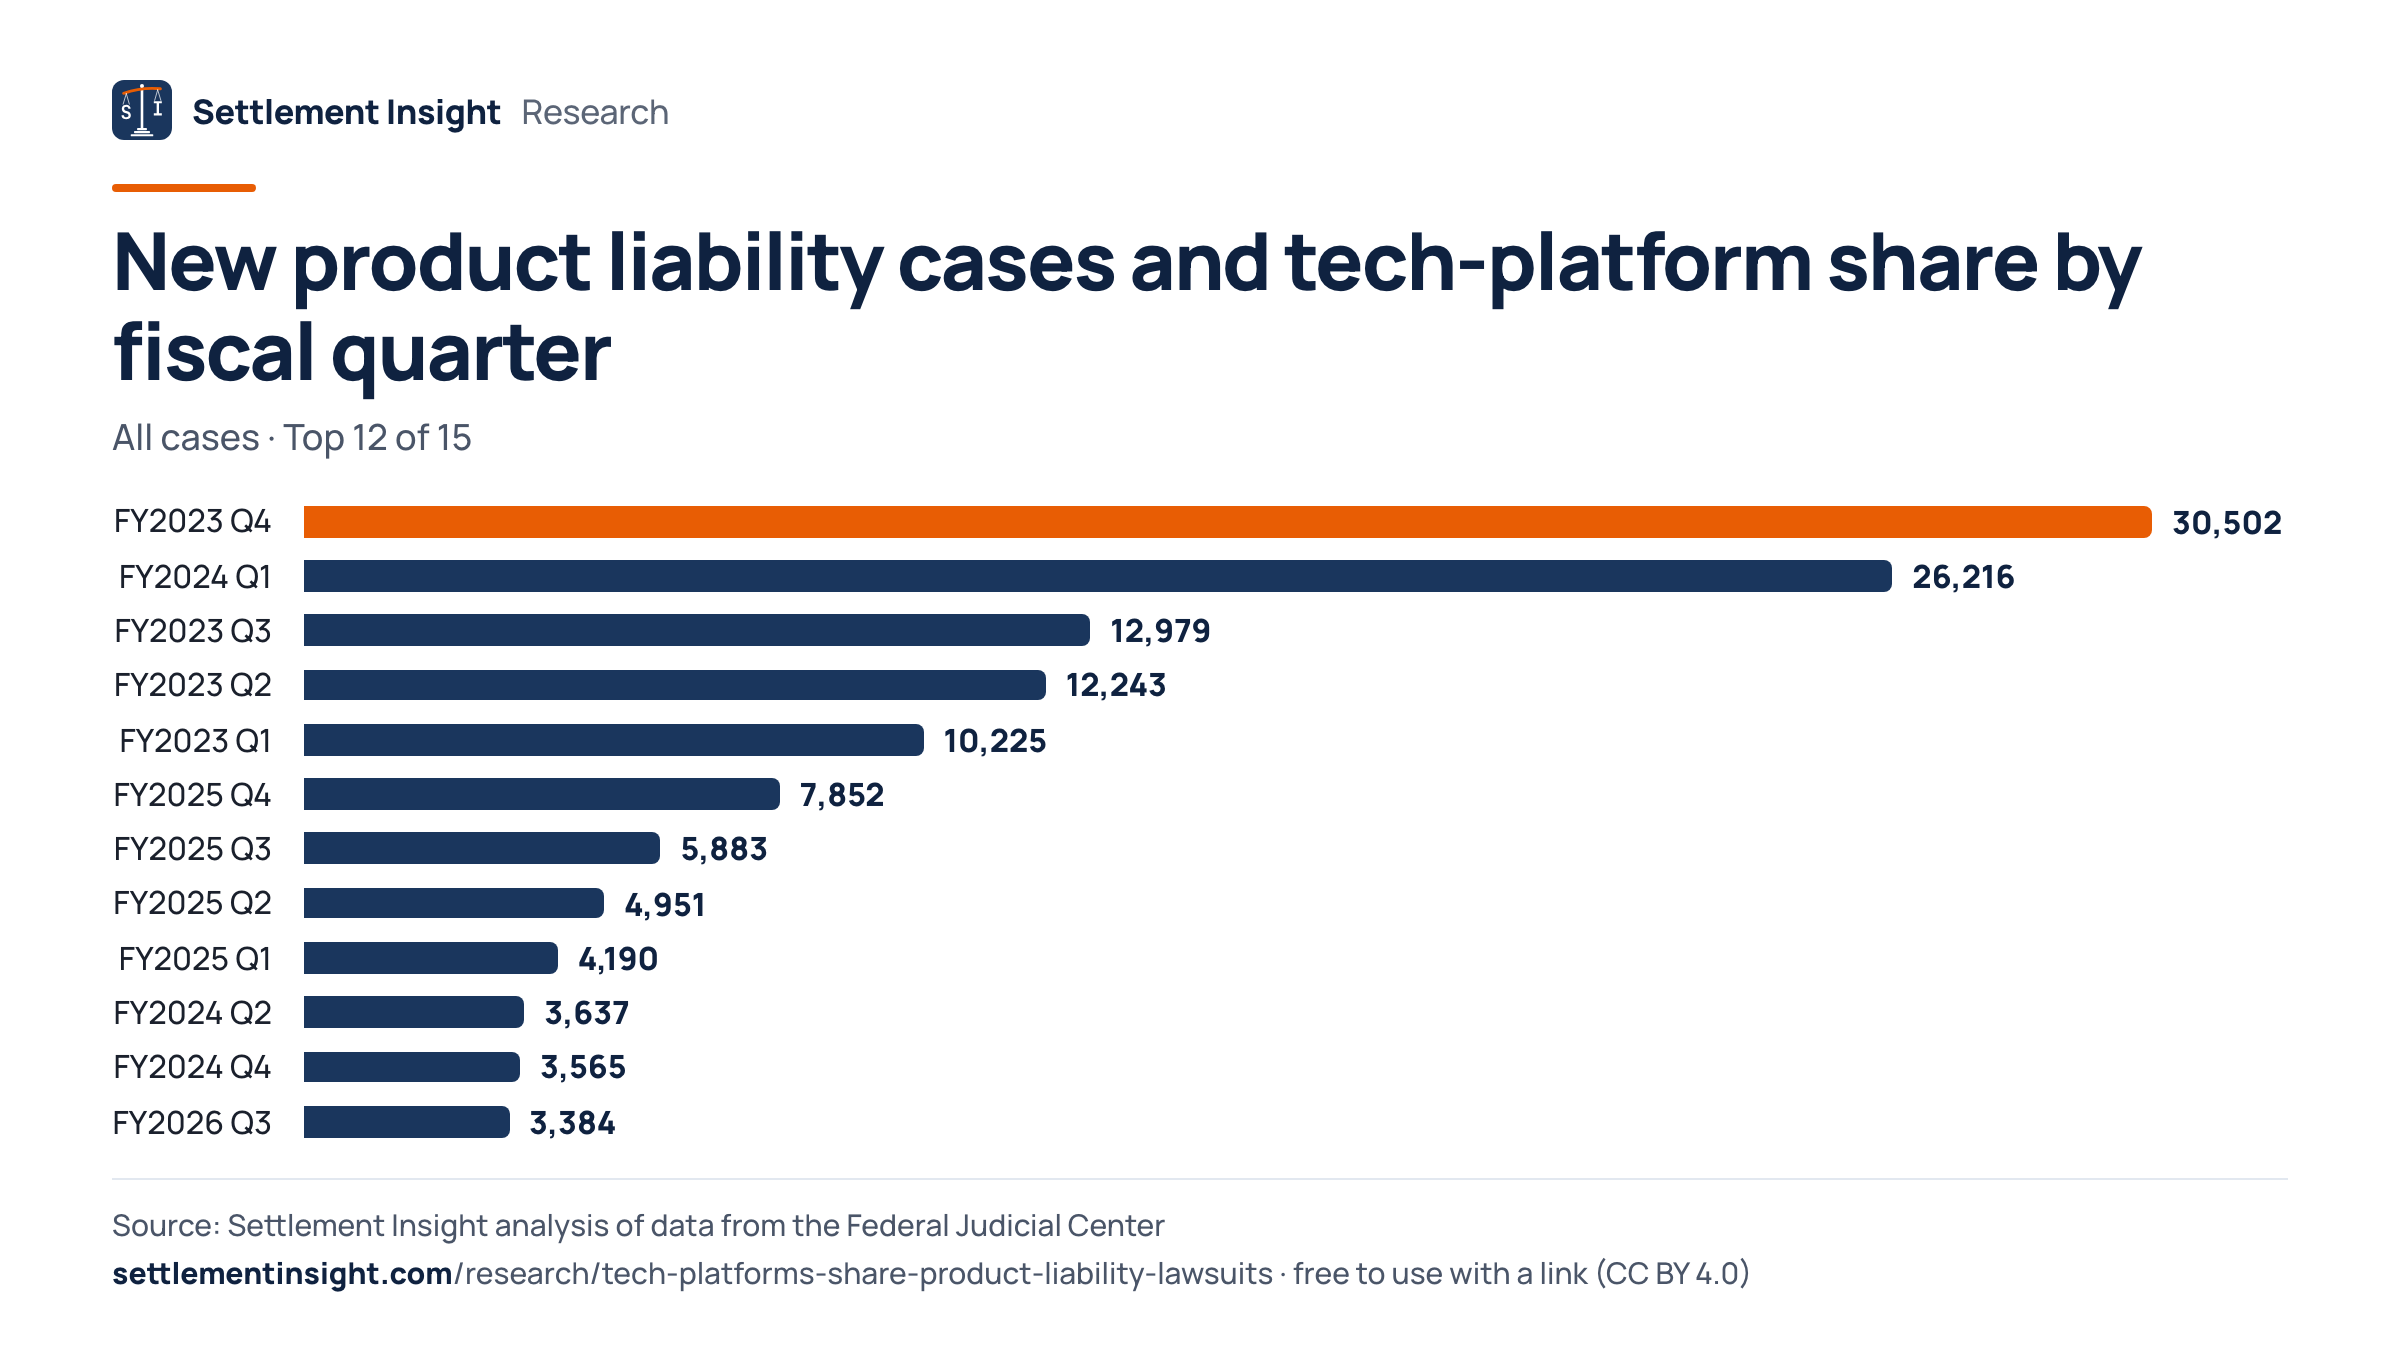
Quarter by quarter, the platform share has swung with mass filings into the MDLs, but each quarter of fiscal 2026 was higher than the one before.
Platform cases made up 25.5% of new product liability filings across the first three quarters of fiscal 2026. Outside direct MDL filings the share was 21.2%.
Large batches of complaints filed directly into an MDL court produce sharp quarterly jumps, as in the July–September 2024 quarter. In fiscal 2026 to date, 71.0% of platform cases were filed directly into an MDL court. The CSV lists every quarter from October 2022 on.
New product liability cases and tech-platform share by fiscal quarter
| Quarter | All cases | Platforms | Share |
|---|---|---|---|
| FY2023 Q1 | 10,225 | 104 | 1.0% |
| FY2023 Q2 | 12,243 | 26 | 0.2% |
| FY2023 Q3 | 12,979 | 57 | 0.4% |
| FY2023 Q4 | 30,502 | 94 | 0.3% |
| FY2024 Q1 | 26,216 | 121 | 0.5% |
| FY2024 Q2 | 3,637 | 75 | 2.1% |
| FY2024 Q3 | 2,989 | 121 | 4.0% |
| FY2024 Q4 | 3,565 | 1,014 | 28.4% |
All quarters
| Quarter | All cases | Platforms | Share |
|---|---|---|---|
| FY2025 Q1 | 4,190 | 679 | 16.2% |
| FY2025 Q2 | 4,951 | 966 | 19.5% |
| FY2025 Q3 | 5,883 | 435 | 7.4% |
| FY2025 Q4 | 7,852 | 544 | 6.9% |
| FY2026 Q1 | 2,489 | 549 | 22.1% |
| FY2026 Q2 | 2,675 | 654 | 24.4% |
| FY2026 Q3 | 3,384 | 980 | 29.0% |
Fiscal Q1 is October to December. FY2026 Q3 (April to June 2026) is the latest quarter in the data and may still gain late-reported cases.
Where Tech Platform Product Liability Suits Are Filed
Nearly all platform product liability cases are docketed in one federal court.
Of the 4,807 platform cases filed from October 2024 to June 2026, 94.9% were in the Northern District of California. In all, the cases were filed in 32 districts.
The concentration reflects the MDLs: once the panel centralizes a litigation, new cases are filed directly in the MDL court or transferred there. A case filed elsewhere and later transferred appears in both courts' filings, as in Table C-2.
Tech-platform product liability cases by federal district, Oct 2024–Jun 2026
- California Northern4,56094.86% of platform cases
- Minnesota1763.66% of platform cases
- Pennsylvania Eastern240.50% of platform cases
- Delaware40.08% of platform cases
- Texas Southern30.06% of platform cases
- California Central30.06% of platform cases
All districts
- Colorado30.06% of platform cases
- New York Northern20.04% of platform cases
- New Jersey20.04% of platform cases
- Florida Middle20.04% of platform cases
- Georgia Northern20.04% of platform cases
- Texas Eastern20.04% of platform cases
- Kentucky Eastern20.04% of platform cases
- Nevada20.04% of platform cases
- Washington Western20.04% of platform cases
- Oklahoma Western20.04% of platform cases
- New York Southern10.02% of platform cases
- Vermont10.02% of platform cases
- Pennsylvania Western10.02% of platform cases
- Maryland10.02% of platform cases
- Virginia Eastern10.02% of platform cases
- Florida Southern10.02% of platform cases
- Louisiana Eastern10.02% of platform cases
- Kentucky Western10.02% of platform cases
- Tennessee Middle10.02% of platform cases
- Illinois Northern10.02% of platform cases
- Arkansas Eastern10.02% of platform cases
- Iowa Southern10.02% of platform cases
- Missouri Western10.02% of platform cases
- Nebraska10.02% of platform cases
- Montana10.02% of platform cases
- Oklahoma Eastern10.02% of platform cases
Download the Data and Cite This Study
Every table as a CSV file and in one Excel workbook, a short PDF summary and every chart as an image, free to reuse with attribution (CC BY 4.0).
- Federal district courts receiving tech-platform product liability lawsuits, Oct 2024-Jun 2026Where the tech-platform NOS 365 cases filed between October 2024 and June 2026 were docketed. · 32 rows · CSV, 1 KB
- New federal product liability lawsuits naming each tech platform first, FY2025 and FY2026 to dateCases by platform group (first-named defendant) with each group's share of all NOS 365 filings in FY2025 and in October 2025 to June 2026. · 8 rows · CSV, 1 KB
- Tech platforms' share of new federal product liability (NOS 365) lawsuits by fiscal yearNew NOS 365 civil cases per federal fiscal year and how many name Meta, Uber, Roblox, Snap, TikTok/ByteDance, Google/YouTube, Discord or Character Technologies as first defendant, FY2022 onward; FY2026 covers October 2025 to June 2026 only. · 5 rows · CSV, 1 KB
- Tech platforms' share of new federal product liability lawsuits by fiscal quarterQuarterly NOS 365 filings and tech-platform filings from FY2023 Q1 (Oct-Dec 2022) to FY2026 Q3 (Apr-Jun 2026). · 15 rows · CSV, 1 KB
- All tables in one Excel workbookOne sheet per table plus an About sheet with sources, method and citation · Excel (.xlsx), 14 KB
- Summary to print or forward (3 pages)Short answer, key figures, main chart, findings, method and citation · PDF, 184 KB
Charts for your story
Share of new NOS 365 product liability cases naming a tech platform first
Embed this chart
New product liability cases naming each platform first
Embed this chart
New product liability cases and tech-platform share by fiscal quarter
Embed this chart
Tech-platform product liability cases by federal district, Oct 2024–Jun 2026
Embed this chart
How to cite
Goldberg, L. (2026). Tech Platforms in Federal Product Liability Lawsuits — Share of New NOS 365 Cases Naming Meta, Uber, Roblox and Others (FY2016–FY2026) [Data set]. Settlement Insight. https://settlementinsight.com/research/tech-platforms-share-product-liability-lawsuits
BibTeX
@dataset{goldberg_2026_tech_platforms_share_product_liability_lawsuits,
  author    = {Goldberg, Leonard},
  title     = {Tech Platforms in Federal Product Liability Lawsuits --- Share of New NOS 365 Cases Naming Meta, Uber, Roblox and Others (FY2016--FY2026)},
  year      = {2026},
  publisher = {Settlement Insight},
  url       = {https://settlementinsight.com/research/tech-platforms-share-product-liability-lawsuits}
}How We Measured
Checked against published figures
- Civil cases commenced in U.S. district courts in FY2025 (12 months ending Sept. 30, 2025), Personal Injury/Product Liability - Other (NOS 365): published 22,879, our count 22,876 (0.01% apart).Table C-2. U.S. District Courts - Civil Cases Commenced, by Basis of Jurisdiction and Nature of Suit, During the 12-Month Periods Ending September 30, 2024 and 2025
- Civil cases commenced in U.S. district courts in FY2024 (12 months ending Sept. 30, 2024), Personal Injury/Product Liability - Other (NOS 365): published 36,515, our count 36,407 (0.30% apart).Table C-2. U.S. District Courts - Civil Cases Commenced, by Basis of Jurisdiction and Nature of Suit, During the 12-Month Periods Ending September 30, 2024 and 2025
Full method and limits of the data
We counted every civil case with nature of suit code 365 (Personal Injury - Product Liability, the U.S. Courts category "Other" product liability) filed between October 1, 2015 and June 30, 2026, by federal fiscal year (October to September). Health care and pharmaceutical (367) and asbestos (368) cases are not included. Where the same case (district, office, docket, origin and filing date) appears in two annual IDB releases, we kept only the newest record (3,786 duplicates removed). Reopened and transferred cases count as new filings, as they do in the judiciary's own statistics.
A case counts as a tech-platform case when its first-listed defendant begins with the name of Meta Platforms, Facebook, Instagram or WhatsApp; Uber Technologies; Roblox; Snap; TikTok or ByteDance; Google, YouTube or Alphabet; Discord; or Character Technologies. We reviewed every name variant and excluded look-alikes such as Snap-on.
Calibration: for fiscal 2025 we count 22,876 NOS 365 filings; U.S. Courts Table C-2 reports 22,879, a gap of 0.01%. For fiscal 2024 we count 36,407 against 36,515 (0.30% below).
What this data cannot tell you
- The IDB records only the first-listed defendant, cut to a fixed length. Cases that name a platform second or later, common in social media suits that name Meta, Snap, TikTok and Google together, count once or not at all, so platform involvement is understated.
- A case is a docket, not a plaintiff or an injury. Mass filings into an MDL can add hundreds of dockets in a few days, and a case transferred between districts is counted in both.
- The share depends on the denominator. Product liability filings fell sharply as new filings naming 3M in the earplug and firefighting-foam MDLs dropped, which raises the platform share even where platform filings grew more slowly.
- The latest months may be incomplete. Courts report filings to the Administrative Office with a delay and records are corrected in later releases, so the April–June 2026 quarter can still change and quarter-to-quarter differences at the end of the series should not be read as a trend on their own.
- Filing counts say nothing about the merits. Most of these cases are pending, and the data do not show whether any claim is valid or how it will be resolved. Online marketplaces such as Amazon, sued as product sellers, and app companies outside the eight groups, such as Lyft or Epic Games, are not counted as tech platforms here.
Frequently Asked Questions
How many lawsuits are against Meta?
From October 2024 to June 2026, 2,373 new federal product liability cases named Meta Platforms (or Facebook or Instagram) as the first defendant. Most are part of the social media adolescent addiction MDL in the Northern District of California.
How many Roblox lawsuits have been filed?
Federal court data show 36 product liability cases naming Roblox first in fiscal 2025 and 135 from October 2025 to June 2026. Cases naming Roblox as a second or later defendant are not included.
How many Uber sexual assault lawsuits are there?
From October 2024 to June 2026, 2,137 new federal product liability cases named Uber first, most of them in the passenger sexual assault MDL. The Judicial Panel on Multidistrict Litigation listed 3,940 pending actions in that MDL on July 1, 2026.
What share of product liability lawsuits are against tech companies?
Meta, Uber, Roblox and five other platforms were the first-named defendant in 25.5% of new federal product liability suits outside health care, pharmaceutical and asbestos cases from October 2025 to June 2026, and in 11.5% in fiscal 2025.
Is the social media addiction lawsuit a product liability case?
In federal court data, these suits are filed under the product liability nature of suit code. The MDL itself is titled In re: Social Media Adolescent Addiction/Personal Injury Products Liability Litigation.
Why did the tech platform share rise so fast?
Platform filings grew, from 219 a month in fiscal 2025 to 243 in fiscal 2026 to date, while other product liability filings fell as new filings naming 3M dropped. 3M's share of filings dropped from 47.5% to 8.2%.
Sources
- Integrated Database (IDB): Civil cases filed, terminated, and pending from SY 1988 to present — Federal Judicial Center
- IDB Civil Codebook 1988 Forward — Federal Judicial Center
- Table C-2. U.S. District Courts - Civil Cases Commenced, by Basis of Jurisdiction and Nature of Suit (September 30, 2025) — Administrative Office of the U.S. Courts
- MDL Statistics Report - Distribution of Pending MDL Dockets by Actions Pending (July 1, 2026) — Judicial Panel on Multidistrict Litigation
 Independent analysis. Settlement Insight is not a law firm and not affiliated with any agency named here. Analysis by Leonard Goldberg, Editor. How we work: methodology, our data.
More Research and Data
Other studies from our database of public legal records — each with free CSV downloads.
Related research
- Product Liability Case OutcomesHow federal product liability cases end: settlements, dismissals and trials.
- How Long MDLs LastDuration of multidistrict litigations from creation to closing.
- COPPA PenaltiesCivil penalties for children's online privacy violations.
- PFAS Share of Contamination LawsuitsHow much of one federal case category a single litigation wave takes up.
Latest studies
- Most-sued employers under the ADAWalmart was first-named in 216 federal ADA employment suits, FY2021–25, the most of any employer
- Solar loan complaints by lenderMosaic and its successor servicer drew 64.9% of CFPB complaints about eleven solar lenders since 2019
- Tribal lenders in payday complaintsDocumented tribal lenders drew 18.6% of 2025 CFPB payday loan complaints
- Who files the most FOIA lawsuitsJudicial Watch was first plaintiff in 6.0% of all FOIA lawsuits filed in FY2025