Does Hiring a Lawyer Increase Your Settlement? What 308,317 Federal Injury Cases Show
Original analysis of 308,317 records from the Federal Judicial Center, FY2010–FY2025 (cases terminated Oct. 1, 2009 – Sept. 30, 2025). Published October 22, 2026.
We counted 308,317 personal injury cases that ended in U.S. district courts in fiscal years 2010 through 2025, outside multidistrict litigation, and compared how they ended when the plaintiff had a lawyer and when the plaintiff sued pro se.
Key findings on injury lawsuits with and without a lawyer
Of 284,080 federal personal injury cases in which the plaintiff had a lawyer, 56.8% ended in a settlement, against 9.6% of 24,237 cases brought by plaintiffs without a lawyer, fiscal years 2010–2025, outside multidistrict litigation. Represented cases settled 5.9× as often. Courts dismissed 59.0% of the self-represented cases and 18.3% of the represented ones. The figures show an association, not the effect of hiring a lawyer: lawyers choose which cases to take.
- 56.8%Federal injury cases with a lawyer that settled, outside MDL
- 9.6%Injury cases without a lawyer that settled, outside MDL
- 59.0%Injury cases without a lawyer dismissed, outside MDL
Settlement 5.9× as often with a lawyer
Outside multidistrict litigation, 56.8% of represented injury cases ended as settled, against 9.6% of cases filed pro se. Counting voluntary dismissals as well, the shares are 73.3% and 17.0%.
Most pro se cases were dismissed
Courts dismissed 59.0% of cases brought without a lawyer, 3.2× the rate for represented plaintiffs (18.3%). Another 17.1% ended in a judgment on a pretrial motion.
Car accident cases: 62.4% vs. 19.9%
In motor vehicle injury cases, 62.4% of represented plaintiffs settled, against 19.9% of the 1,584 cases brought without a lawyer.
The gap holds in every case type
In all 13 personal injury case types and in each of the 16 fiscal years, represented cases settled more often than pro se cases.
Trials are rare either way
Only 1.7% of represented cases and 0.6% of pro se cases ended in a trial verdict. Represented plaintiffs won 47.8% of the 4,761 verdicts with a recorded winner; pro se plaintiffs won 27 of 152.
Quote this finding
Of 284,080 federal personal injury cases in which the plaintiff had a lawyer, 56.8% ended in a settlement, against 9.6% of 24,237 cases brought by plaintiffs without a lawyer, fiscal years 2010–2025, outside multidistrict litigation. Source: Settlement Insight, Injury Lawsuits With vs. Without a Lawyer
How Do Injury Lawsuits End With and Without a Lawyer
Each terminated federal case carries a disposition code. We compare final resolutions of injury cases outside multidistrict litigation by whether at least one plaintiff was recorded as pro se.
56.8% of the 284,080 represented cases were settled, against 9.6% of the 24,237 pro se cases. Dismissal by the court was the most common outcome without a lawyer (59.0%).
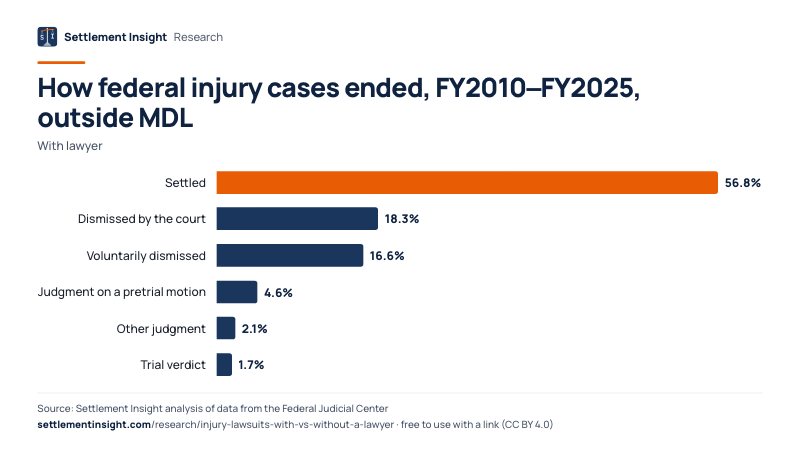
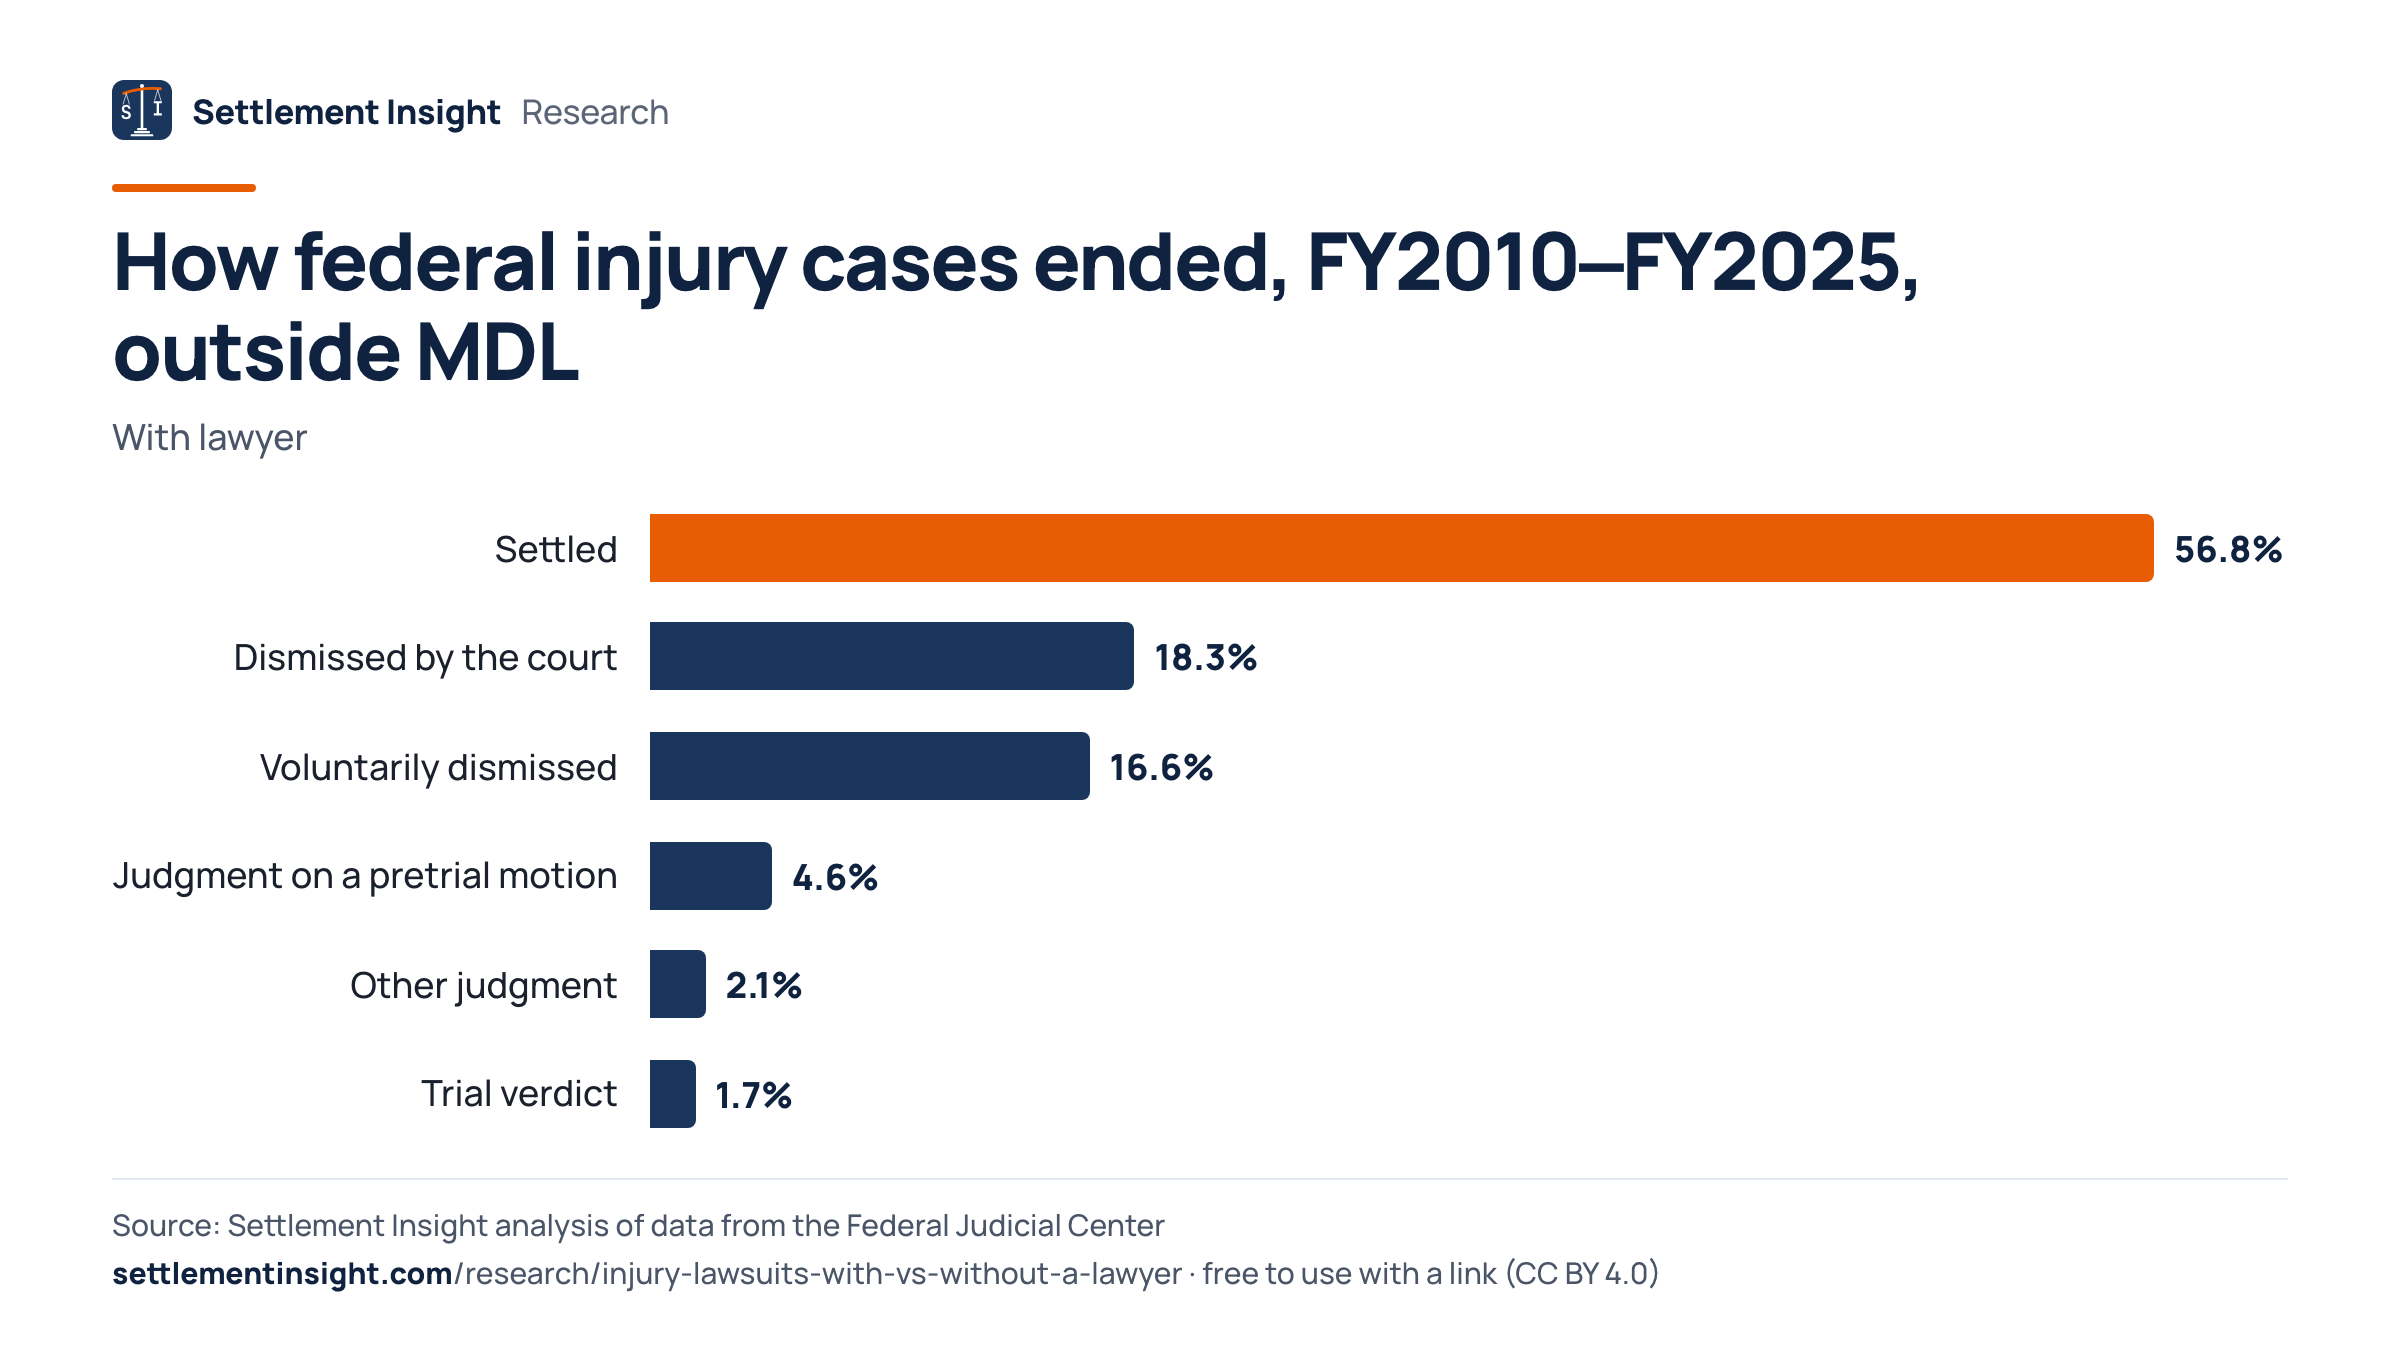
Plaintiffs with a lawyer most often ended their case in a settlement (56.8%), followed by a dismissal by the court (18.3%) and a voluntary dismissal (16.6%). For plaintiffs without a lawyer, the most common ending was a dismissal by the court for want of prosecution, lack of jurisdiction or another reason (59.0%), followed by a judgment on a pretrial motion (17.1%). Together, dismissals and pretrial judgments closed 76.1% of pro se cases and 22.8% of represented cases.
The settled share is a lower bound. The FJC codebook defines a settled case as one disposed of after settlement between the parties out of court; a voluntary dismissal only records that the plaintiff withdrew the case, and some of those follow a private settlement.
Plaintiffs without a lawyer brought 7.9% of all final resolutions in the study.
How federal injury cases ended, FY2010–FY2025, outside MDL
| Outcome | With lawyer | Without |
|---|---|---|
| Settled | 56.8% | 9.6% |
| Dismissed by the court | 18.3% | 59.0% |
| Voluntarily dismissed | 16.6% | 7.4% |
| Judgment on a pretrial motion | 4.6% | 17.1% |
| Other judgment | 2.1% | 6.2% |
| Trial verdict | 1.7% | 0.6% |
Fiscal years run October through September. Transfers to another federal court, remands, bankruptcy stays and statistical closings are not counted as final resolutions.
Is It Worth Getting a Lawyer for a Car Accident Case
Settlement shares by type of injury claim, using the nature-of-suit codes on the civil cover sheet.
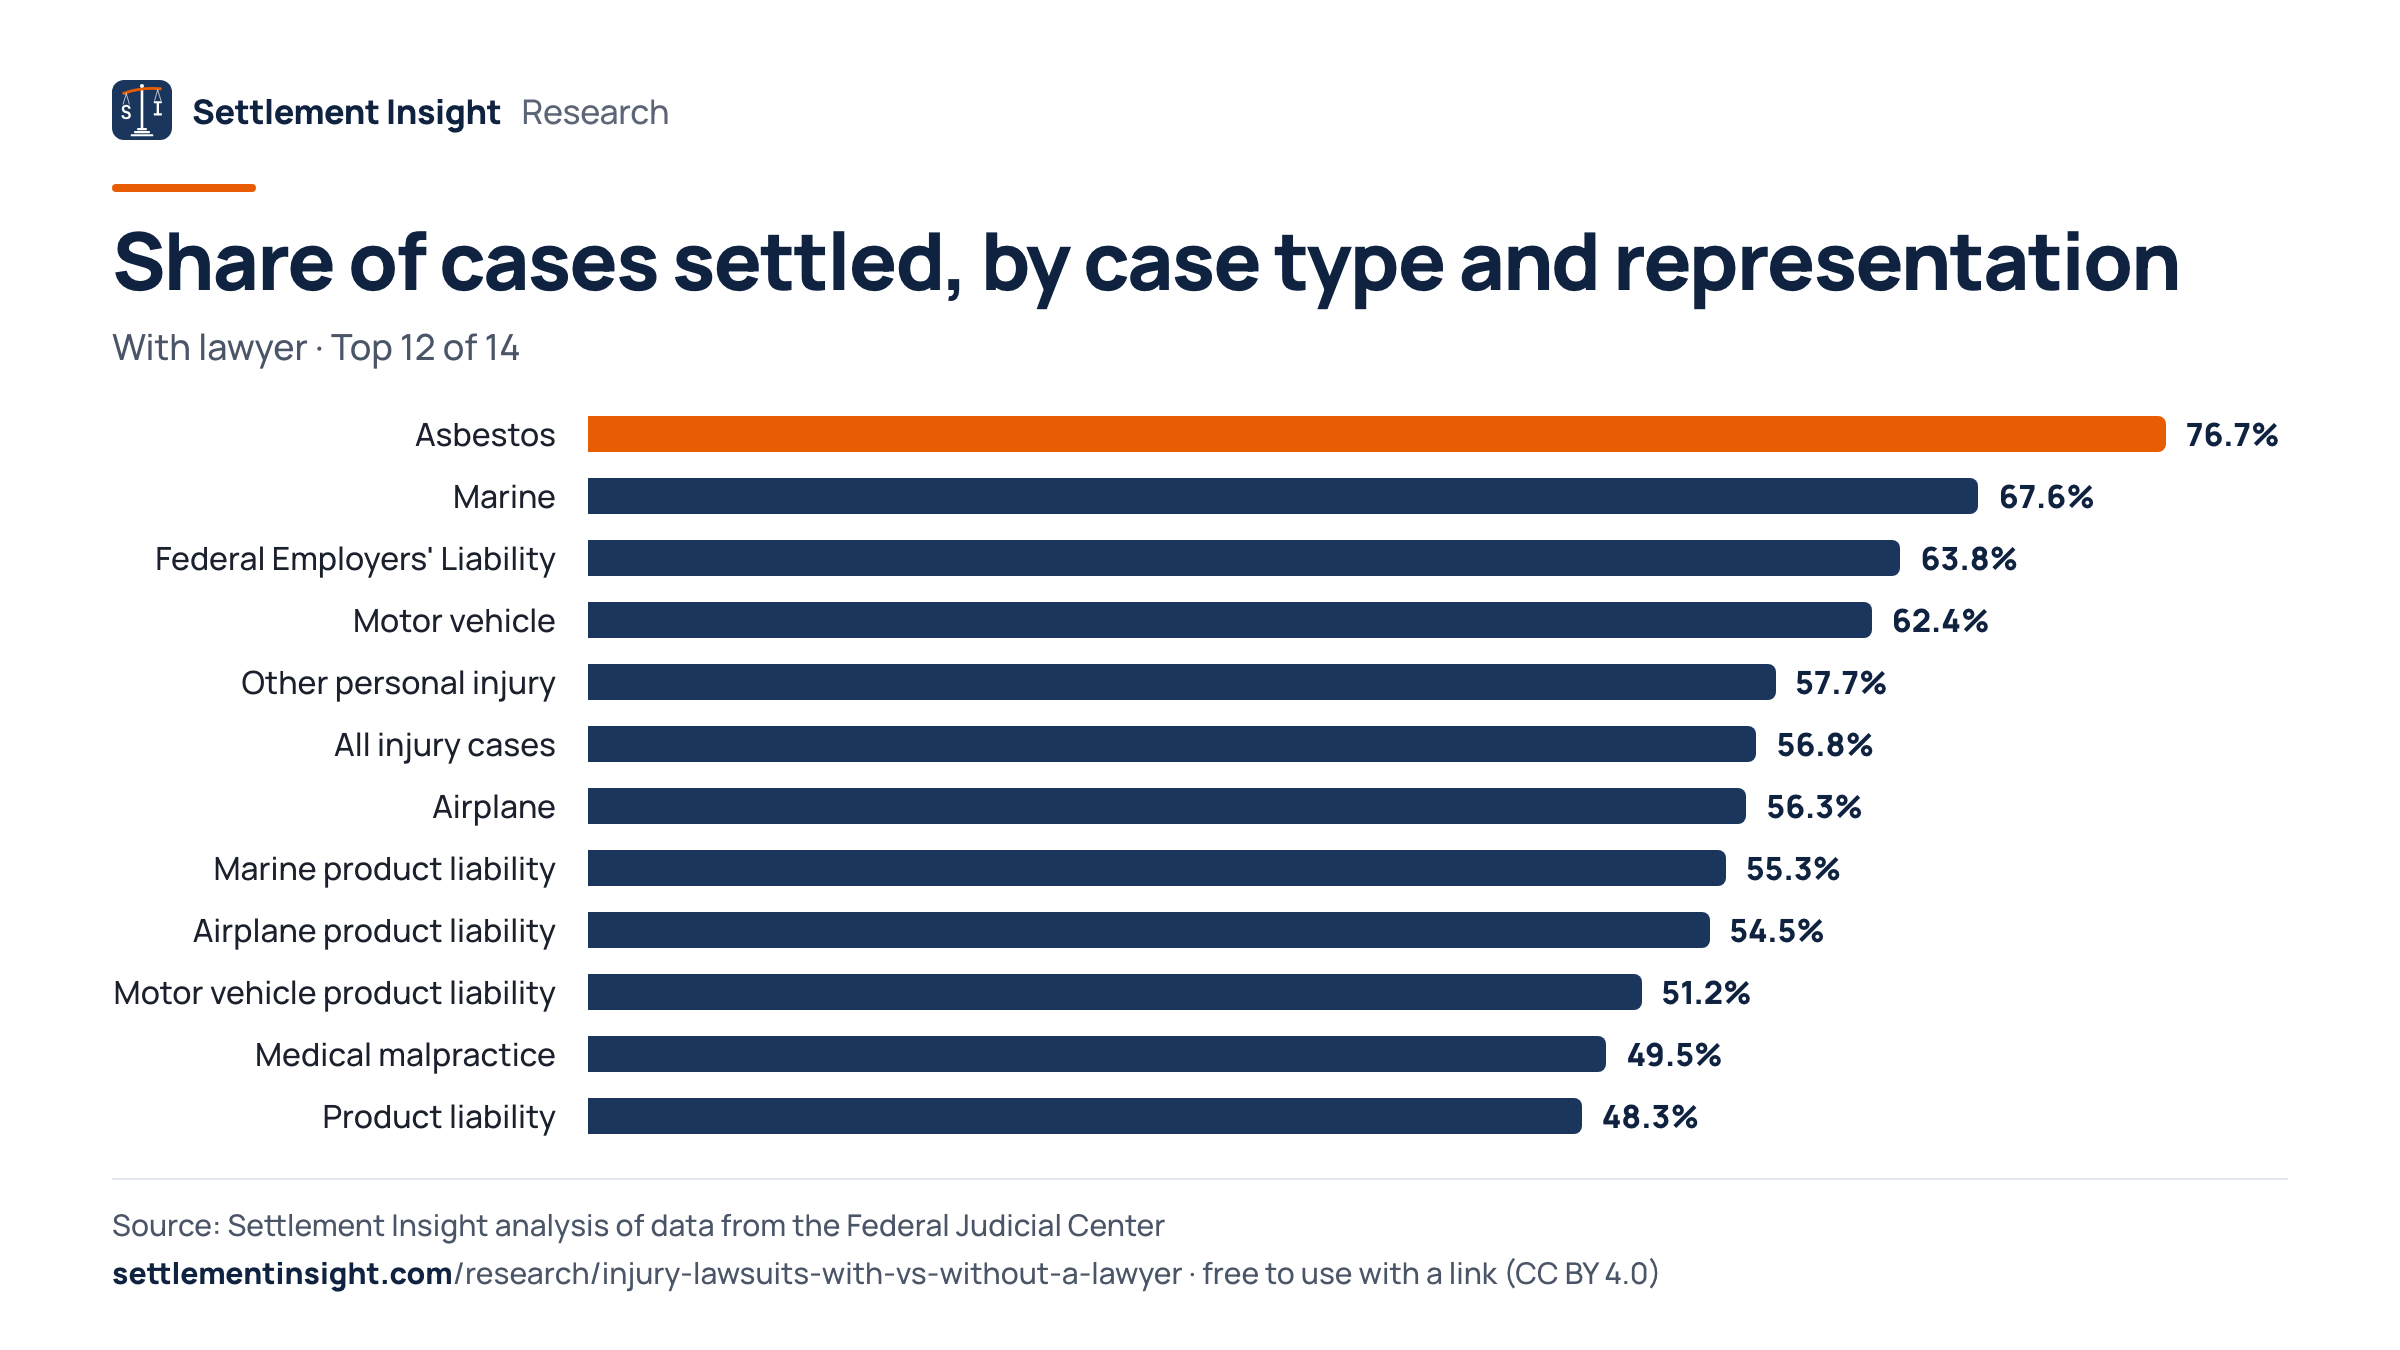
In motor vehicle cases, 62.4% of represented plaintiffs settled, against 19.9% without a lawyer. In medical malpractice the shares were 49.5% and 4.7%.
Car accident cases filed without a lawyer were rare in federal court: 1,584 of them against 61,970 with a lawyer. Courts dismissed 48.6% of the pro se car accident cases and 14.1% of the represented ones.
Medical malpractice showed one of the widest gaps: 49.5% settled with a lawyer and 4.7% without one. In the catch-all category other personal injury, which includes Federal Tort Claims Act suits against the United States, the shares were 57.7% and 8.1%. Product liability cases (codes 365 and 367) outside multidistrict litigation settled in 47.0% of represented cases and 10.3% of pro se cases.
Pro se plaintiffs were most common in assault, libel and slander cases, where they brought 42.2% of final resolutions. Asbestos cases (code 368) are listed separately; most of them ran through multidistrict litigation and are outside this count, leaving 7,443.
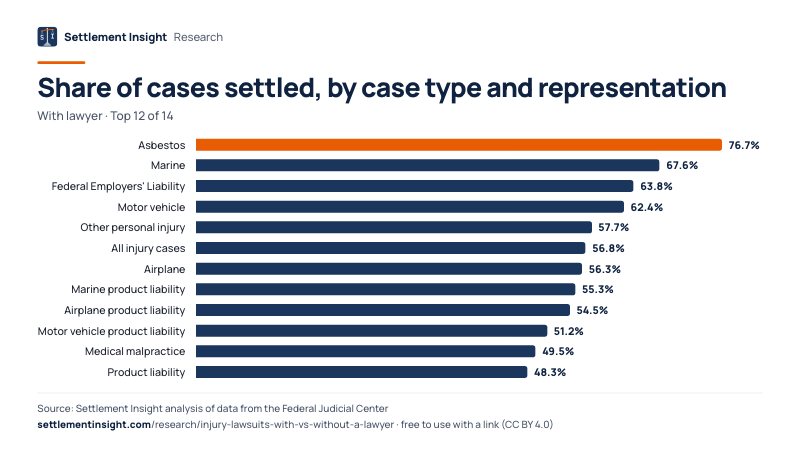
Share of cases settled, by case type and representation
| Case type | With lawyer | Without | Pro se cases |
|---|---|---|---|
| All injury cases | 56.8% | 9.6% | 24,237 |
| Other personal injury | 57.7% | 8.1% | 11,473 |
| Assault, libel and slander | 31.4% | 4.5% | 3,503 |
| Medical malpractice | 49.5% | 4.7% | 2,731 |
| Product liability | 48.3% | 11.3% | 2,717 |
| Motor vehicle | 62.4% | 19.9% | 1,584 |
| Health care/pharmaceutical | 36.7% | 6.2% | 692 |
| Marine | 67.6% | 52.8% | 502 |
All case types
| Case type | With lawyer | Without | Pro se cases |
|---|---|---|---|
| Federal Employers' Liability | 63.8% | 6.2% | 386 |
| Motor vehicle product liability | 51.2% | 10.0% | 299 |
| Airplane | 56.3% | 32.4% | 179 |
| Asbestos | 76.7% | 43.2% | 146 |
| Airplane product liability | 54.5% | 38.9% | 18 |
| Marine product liability | 55.3% | 14.3% | 7 |
Shares are of final resolutions outside multidistrict litigation, FY2010–FY2025. Small case types such as marine product liability have few pro se cases; their shares move a lot with a handful of cases.
Suing the Federal Government Without a Lawyer
The basis of jurisdiction shows who the case was against: the United States as defendant, or private parties from different states (diversity).
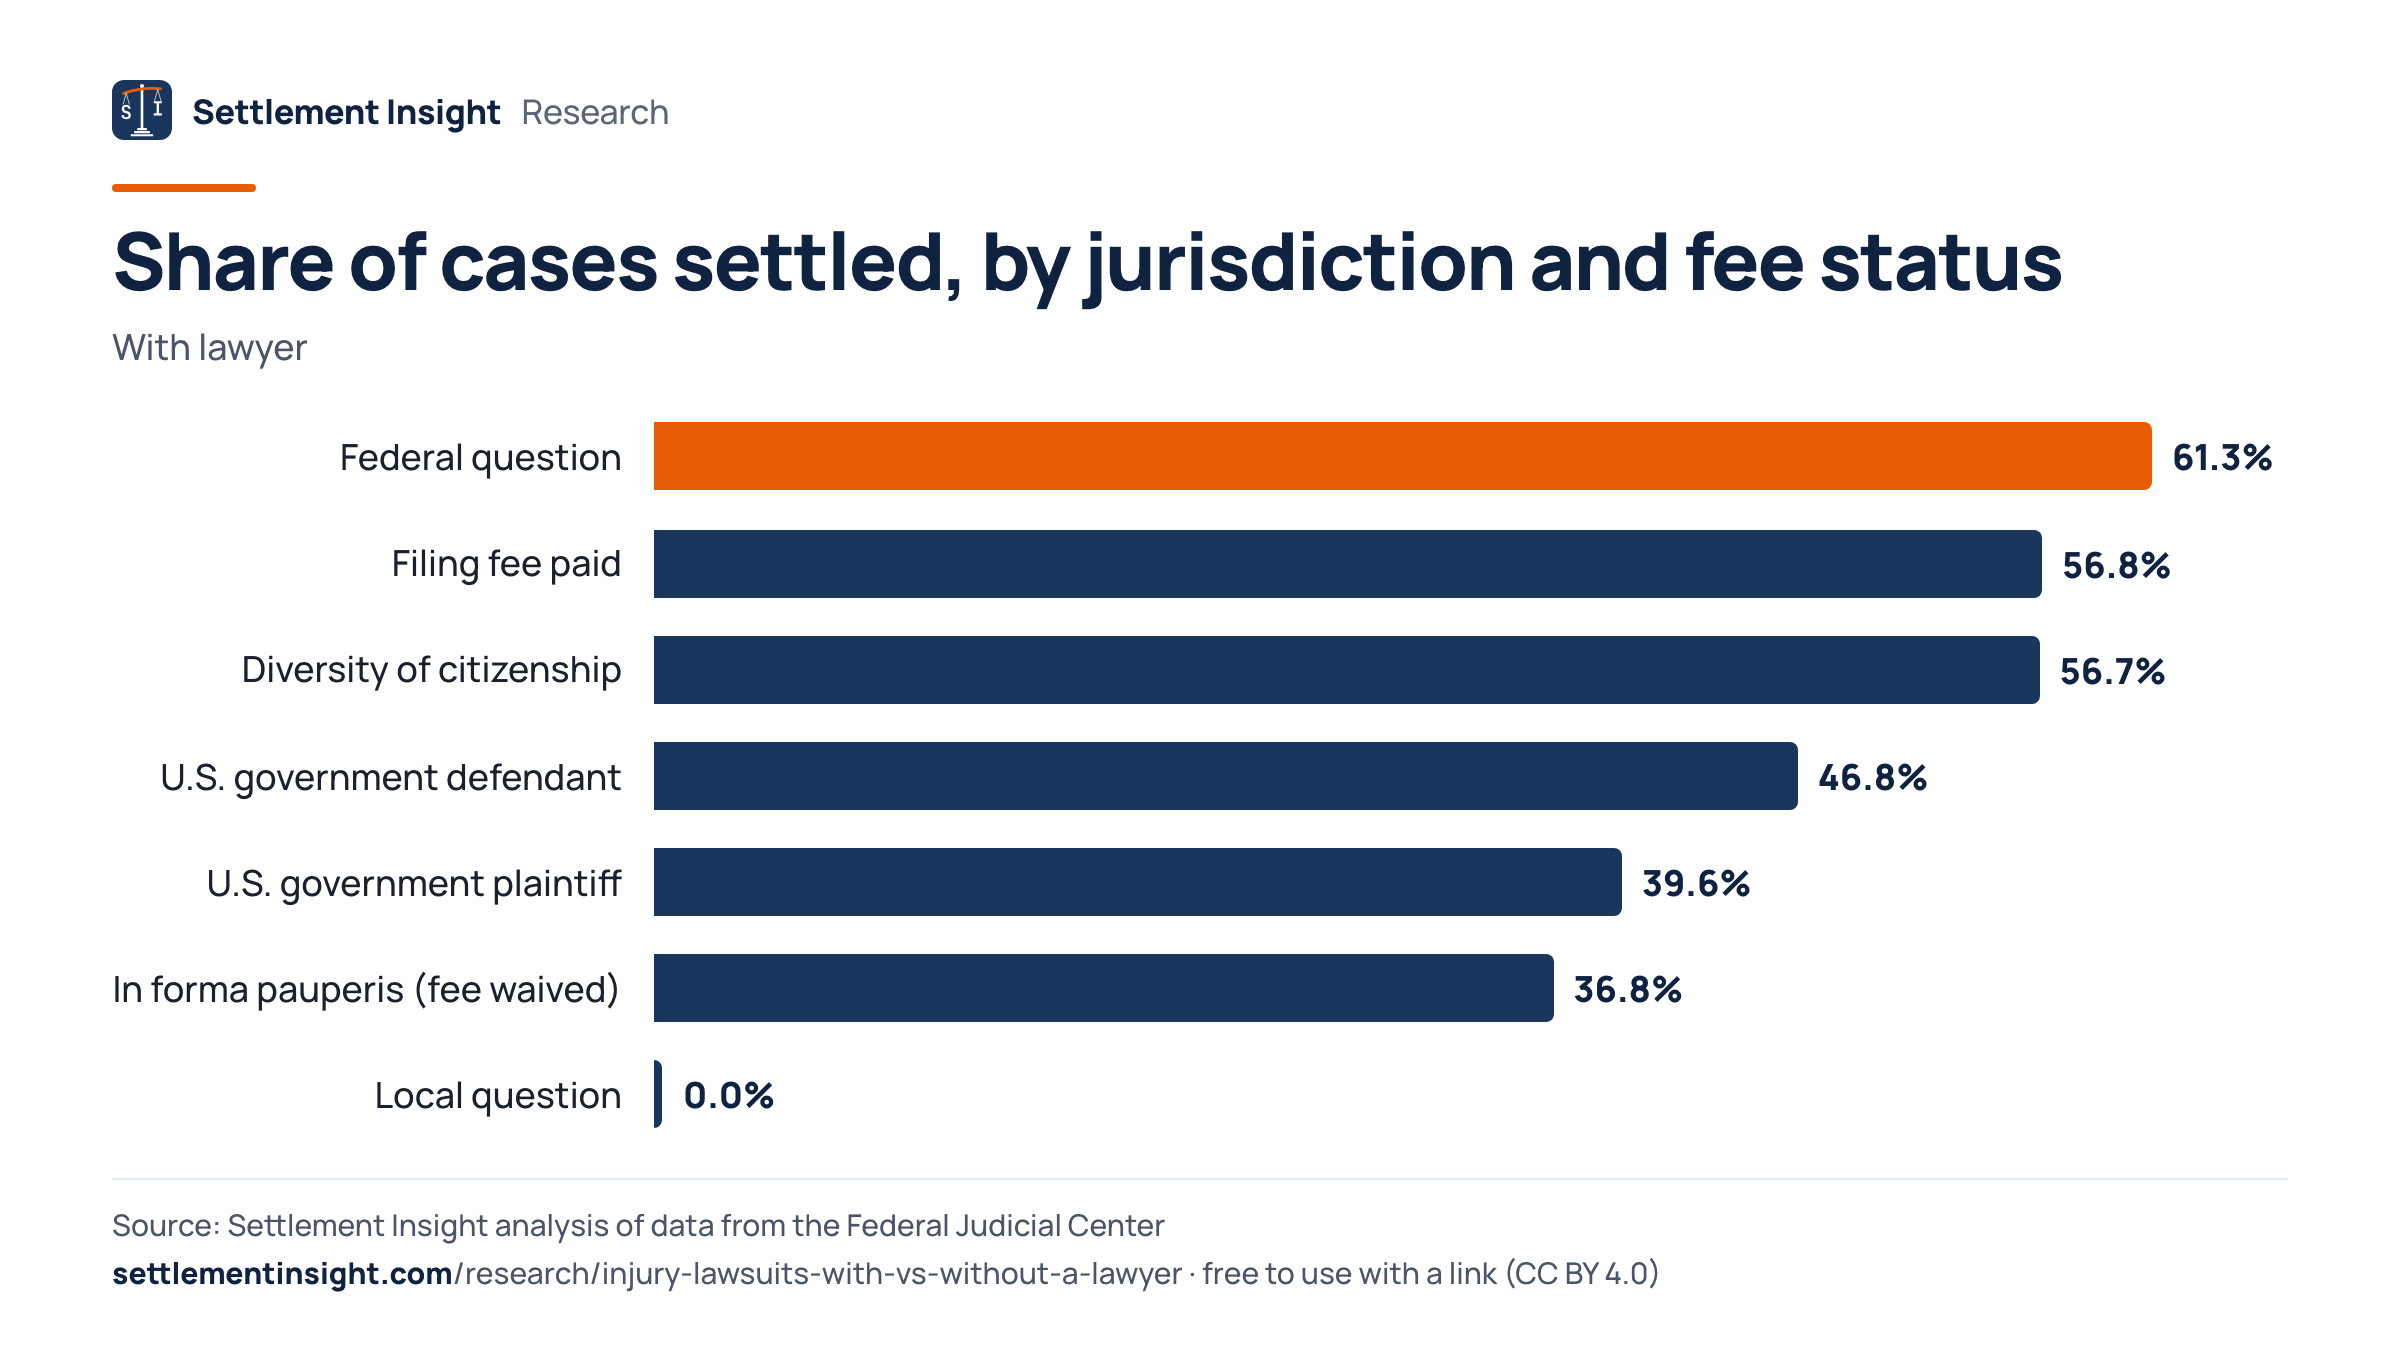
When the United States was the defendant, 46.8% of represented injury cases settled, against 5.7% of the 3,943 pro se cases.
Suits against the United States, which include Federal Tort Claims Act claims, had a higher pro se share (15.3%) than diversity cases between private parties (4.3%). In diversity cases, 56.7% of represented plaintiffs settled and 14.7% of pro se plaintiffs.
Of the plaintiffs who sued without a lawyer, 29.8% were allowed to proceed in forma pauperis, without paying the filing fee. Those cases settled in 4.0% of instances; pro se plaintiffs who paid the fee settled in 12.1%. Federal-question cases made up 44.5% of pro se injury cases.
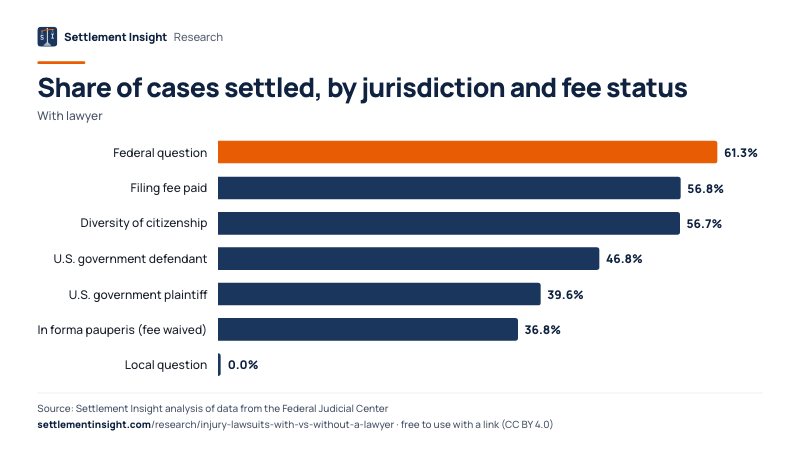
Share of cases settled, by jurisdiction and fee status
| Group | With lawyer | Without | Pro se |
|---|---|---|---|
| In forma pauperis (fee waived) | 36.8% | 4.0% | 92.0% |
| Local question | 0.0% | 0.0% | 20.0% |
| Federal question | 61.3% | 6.6% | 17.8% |
| U.S. government defendant | 46.8% | 5.7% | 15.3% |
| U.S. government plaintiff | 39.6% | 3.6% | 12.7% |
| Filing fee paid | 56.8% | 12.1% | 5.7% |
| Diversity of citizenship | 56.7% | 14.7% | 4.3% |
The Pro se column is the share of each group's cases brought by a plaintiff without a lawyer. In forma pauperis status can change during a case; the FJC notes that the field has no data quality control checks.
How Often Do Injury Plaintiffs Win at Trial
Trial verdicts are jury verdicts, directed verdicts and bench trials. Win rates count verdicts for the plaintiff against verdicts for the defendant.
Represented plaintiffs won 47.8% of 4,761 trial verdicts with a recorded winner. Pro se plaintiffs won 27 of 152.
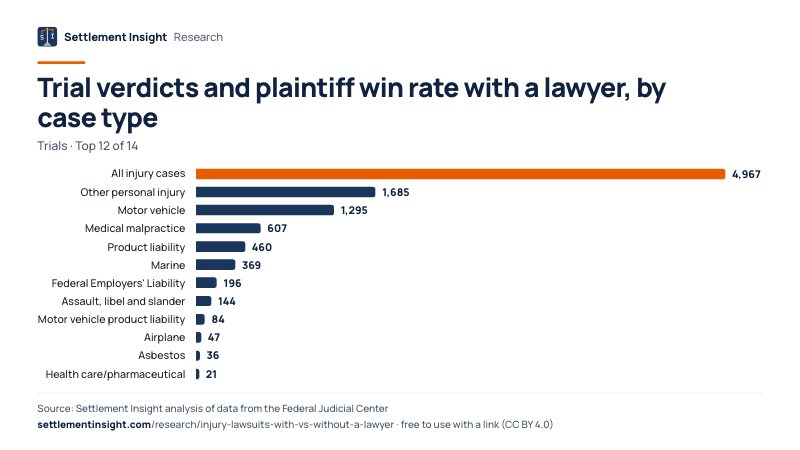
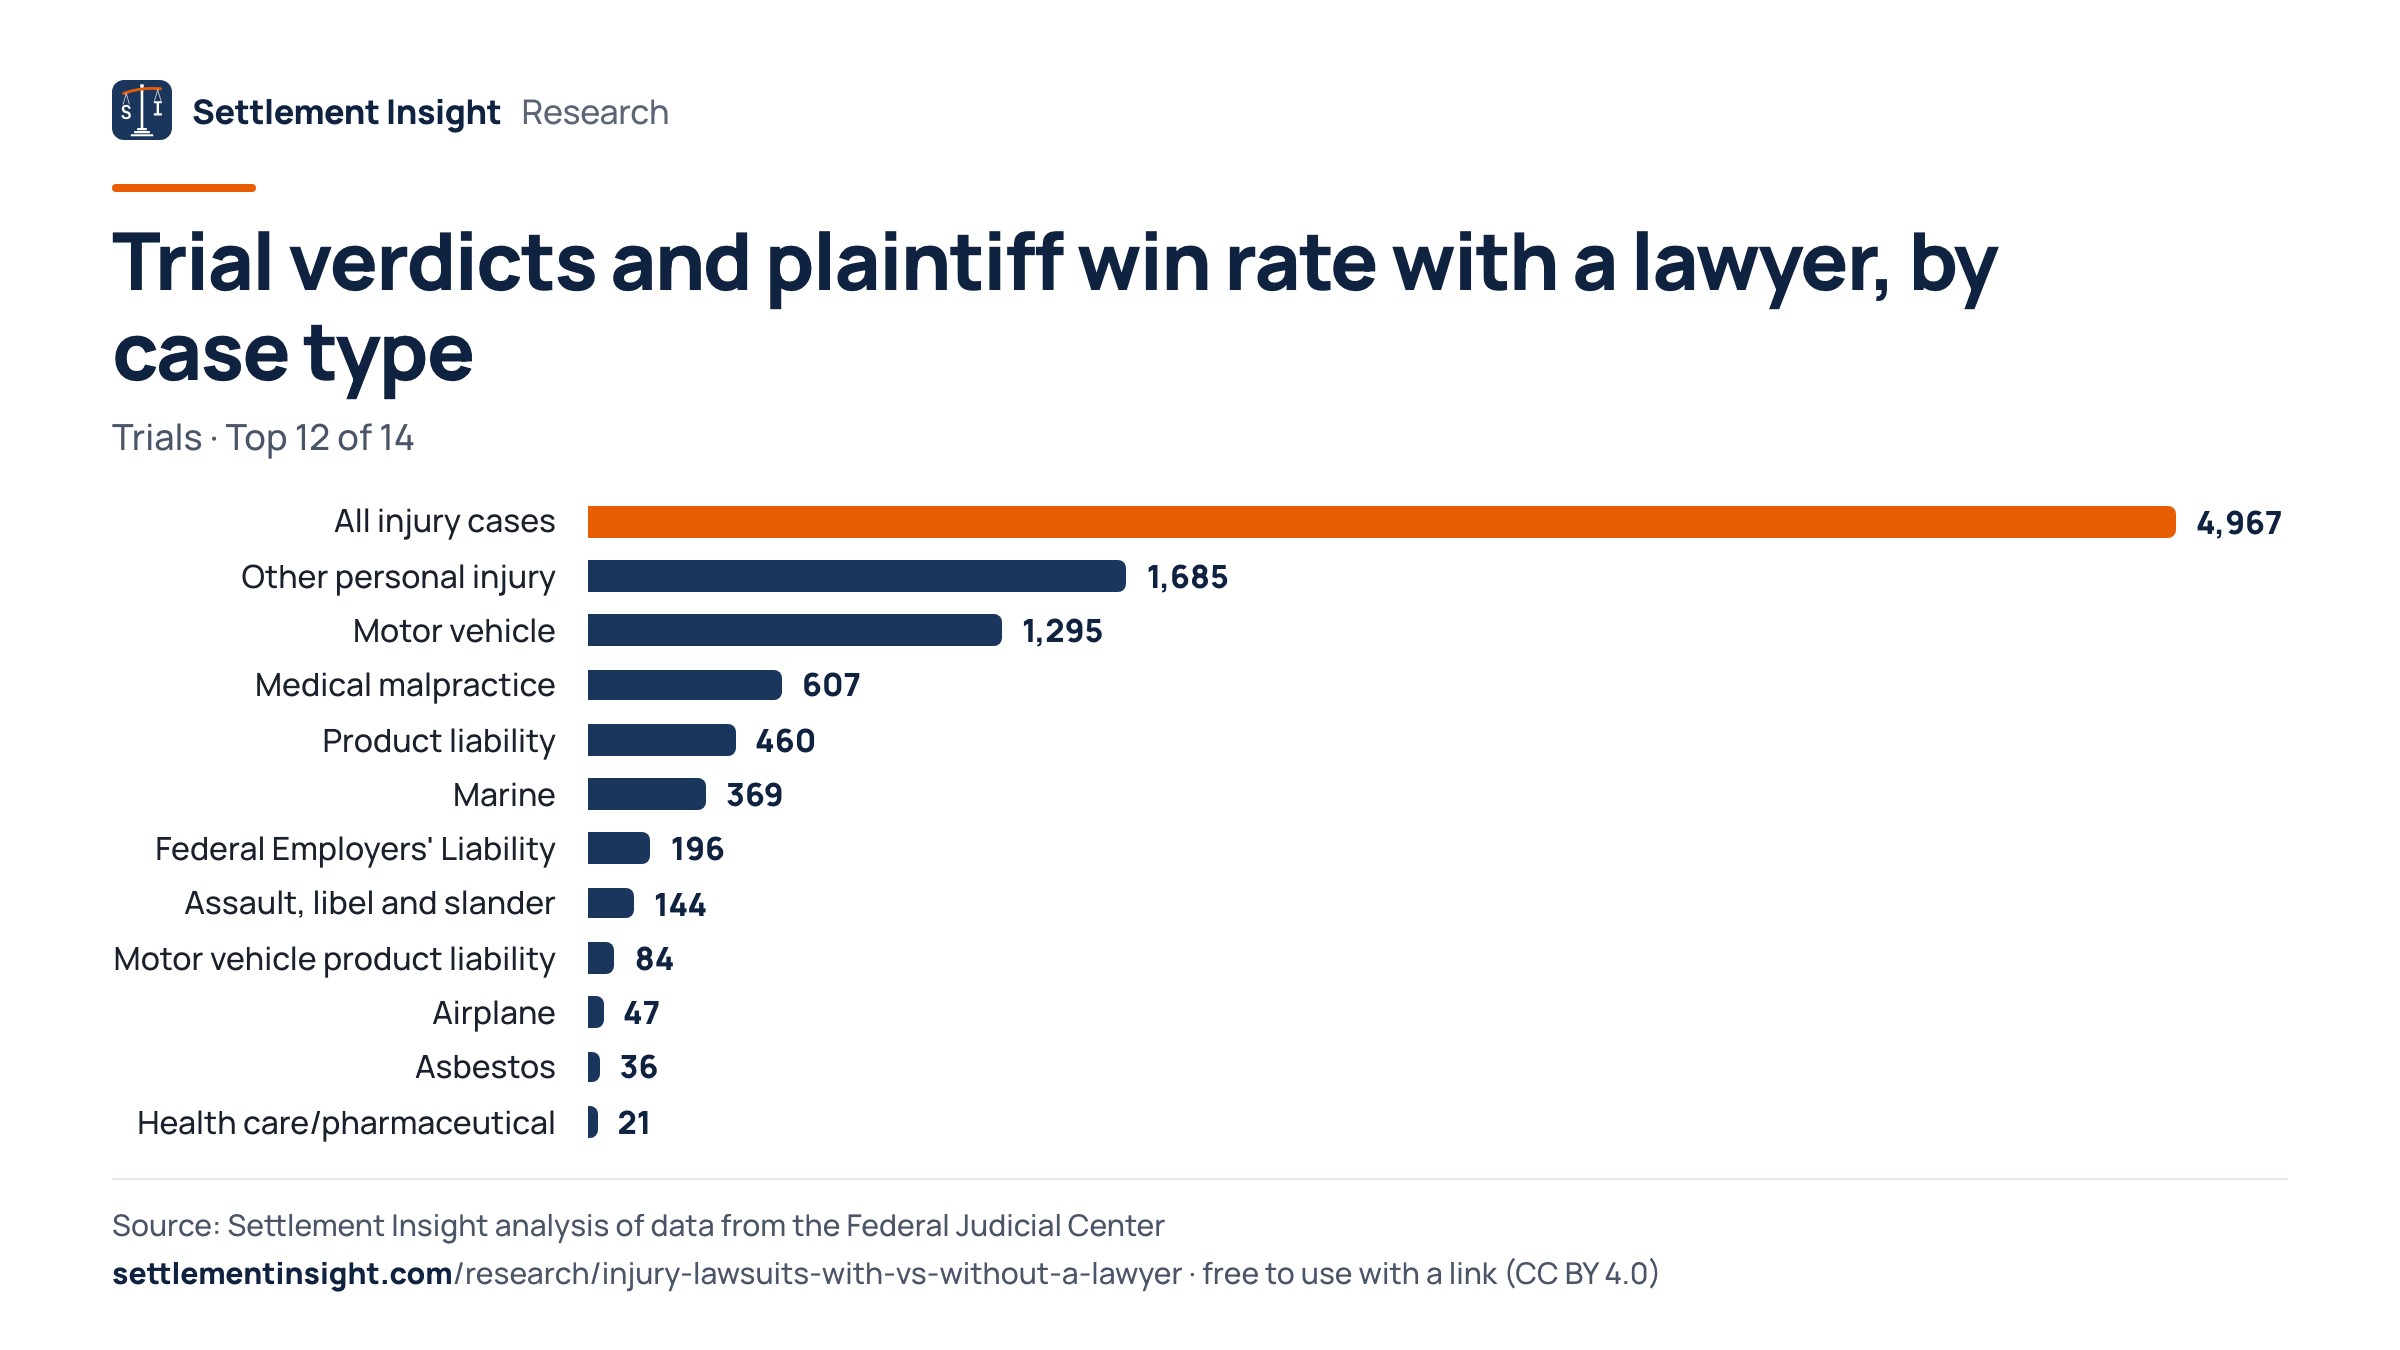
Few cases reach a verdict: 4,967 represented cases (1.7%) and 156 pro se cases (0.6%). In motor vehicle cases, represented plaintiffs won 61.2% of 1,238 verdicts with a recorded winner.
The table shows a win rate only for case types with at least 30 verdicts with a recorded winner. Verdicts coded for both sides or for an unknown party are left out of the rate.
Trial verdicts and plaintiff win rate with a lawyer, by case type
| Case type | Trials | Win rate | Pro se |
|---|---|---|---|
| All injury cases | 4,967 | 47.8% | 156 |
| Other personal injury | 1,685 | 43.9% | 77 |
| Motor vehicle | 1,295 | 61.2% | 27 |
| Medical malpractice | 607 | 36.5% | 12 |
| Product liability | 460 | 29.1% | 11 |
| Marine | 369 | 63.5% | 7 |
| Federal Employers' Liability | 196 | 57.1% | 2 |
| Assault, libel and slander | 144 | 49.2% | 16 |
All case types
| Case type | Trials | Win rate | Pro se |
|---|---|---|---|
| Motor vehicle product liability | 84 | 33.3% | 0 |
| Airplane | 47 | 51.1% | 2 |
| Asbestos | 36 | 32.4% | 0 |
| Health care/pharmaceutical | 21 | — | 2 |
| Airplane product liability | 13 | — | 0 |
| Marine product liability | 10 | — | 0 |
The Pro se column counts trial verdicts in cases brought by a plaintiff without a lawyer.
Has the Gap Changed Since 2010
Settled shares by the fiscal year in which the case ended.
In every fiscal year from 2010 to 2025, represented cases settled more often. The represented share ranged from 45.8% to 66.9%, the pro se share from 5.9% to 14.8%.
In fiscal 2025, 51.9% of represented injury cases and 5.9% of pro se cases ended as settled; in fiscal 2010 the shares were 60.8% and 9.4%. Plaintiffs without a lawyer accounted for 9.7% of final resolutions in fiscal 2025 and 8.3% in fiscal 2010.
Share of injury cases settled, by fiscal year ended
| Fiscal year | With lawyer | Without | Pro se |
|---|---|---|---|
| 2025 | 51.9% | 5.9% | 1,962 |
| 2024 | 53.1% | 6.6% | 1,819 |
| 2023 | 52.6% | 8.0% | 1,597 |
| 2022 | 54.8% | 8.8% | 1,425 |
| 2021 | 54.9% | 7.6% | 1,334 |
| 2020 | 52.7% | 7.7% | 1,459 |
| 2019 | 57.7% | 9.4% | 1,489 |
| 2018 | 61.1% | 11.5% | 1,484 |
All fiscal years
| Fiscal year | With lawyer | Without | Pro se |
|---|---|---|---|
| 2017 | 57.7% | 14.5% | 1,420 |
| 2016 | 58.3% | 14.8% | 1,463 |
| 2015 | 66.9% | 9.1% | 1,447 |
| 2014 | 57.2% | 10.4% | 1,430 |
| 2013 | 45.8% | 11.6% | 1,454 |
| 2012 | 48.7% | 10.0% | 1,456 |
| 2011 | 66.5% | 11.0% | 1,420 |
| 2010 | 60.8% | 9.4% | 1,578 |
The Pro se column counts final resolutions of cases brought without a lawyer. Fiscal years run October through September; fiscal 2025 ended September 30, 2025.
Download the Data and Cite This Study
Every table as a CSV file and in one Excel workbook, a short PDF summary and every chart as an image, free to reuse with attribution (CC BY 4.0).
- Calibration: our FJC counts vs. U.S. Courts Tables C-13 and C-4, FY2025Our counts from the FJC Integrated Database next to the published fiscal 2025 totals for pro se and all civil filings (Table C-13) and motor vehicle injury terminations (Table C-4). · 4 rows · CSV, 1 KB
- Settlement, dismissal and trial outcomes by injury case type and plaintiff representation, FY2010-FY2025For each personal injury nature-of-suit code, final resolutions outside multidistrict litigation with and without a plaintiff's lawyer, the settled and court-dismissed shares, and trial verdicts by winner (win rate shown from 30 trials with a recorded winner). · 14 rows · CSV, 2 KB
- Federal personal injury case outcomes by fiscal year of termination and plaintiff representation, FY2010-FY2025Final resolutions of personal injury cases outside multidistrict litigation per fiscal year of termination, with the settled and court-dismissed shares for plaintiffs with and without a lawyer. · 16 rows · CSV, 1 KB
- Injury case outcomes by basis of jurisdiction and fee status, with and without a plaintiff's lawyer, FY2010-FY2025Final resolutions of federal personal injury cases outside multidistrict litigation by basis of jurisdiction (including suits against the United States) and by in forma pauperis status, with settled and court-dismissed shares by plaintiff representation. · 7 rows · CSV, 1 KB
- How federal personal injury cases ended, with and without a plaintiff's lawyer, FY2010-FY2025Final resolutions of personal injury cases outside multidistrict litigation in U.S. district courts, terminated in fiscal years 2010 through 2025, by outcome and by whether a plaintiff was self-represented. · 6 rows · CSV, 1 KB
- All tables in one Excel workbookOne sheet per table plus an About sheet with sources, method and citation · Excel (.xlsx), 16 KB
- Summary to print or forward (3 pages)Short answer, key figures, main chart, findings, method and citation · PDF, 201 KB
Charts for your story
How federal injury cases ended, FY2010–FY2025, outside MDL
Embed this chart
Share of cases settled, by case type and representation
Embed this chart
Share of cases settled, by jurisdiction and fee status
Embed this chart
Trial verdicts and plaintiff win rate with a lawyer, by case type
Embed this chart
How to cite
Goldberg, L. (2026). Injury Lawsuits With vs. Without a Lawyer — settlement, dismissal and trial outcomes of federal personal injury cases by plaintiff representation (FY2010–FY2025) [Data set]. Settlement Insight. https://settlementinsight.com/research/injury-lawsuits-with-vs-without-a-lawyer
BibTeX
@dataset{goldberg_2026_injury_lawsuits_with_vs_without_a_lawyer,
  author    = {Goldberg, Leonard},
  title     = {Injury Lawsuits With vs. Without a Lawyer --- settlement, dismissal and trial outcomes of federal personal injury cases by plaintiff representation (FY2010--FY2025)},
  year      = {2026},
  publisher = {Settlement Insight},
  url       = {https://settlementinsight.com/research/injury-lawsuits-with-vs-without-a-lawyer}
}How We Measured
Checked against published figures
- U.S. district courts, civil cases filed with a pro se party, all case types, fiscal year 2025 (12 months ending Sept. 30, 2025): published 89,971, our count 90,841 (0.97% apart).Table C-13. U.S. District Courts–Civil Pro Se and Non-Pro Se Filings, by District, During the 12-Month Period Ending September 30, 2025
- U.S. district courts, civil cases filed, all case types, fiscal year 2025: published 303,563, our count 303,625 (0.02% apart).Table C-13. U.S. District Courts–Civil Pro Se and Non-Pro Se Filings, by District, During the 12-Month Period Ending September 30, 2025
- Motor vehicle personal injury cases (NOS 350 and 355) terminated in fiscal year 2025, diversity jurisdiction: published 5,333, our count 5,329 (0.08% apart).Table C-4. U.S. District Courts–Civil Cases Terminated, by Nature of Suit and Action Taken, During the 12-Month Period Ending September 30, 2025
- Motor vehicle personal injury cases (NOS 350 and 355) terminated in fiscal year 2025, United States cases: published 894, our count 893 (0.11% apart).Table C-4. U.S. District Courts–Civil Cases Terminated, by Nature of Suit and Action Taken, During the 12-Month Period Ending September 30, 2025
Full method and limits of the data
Personal injury cases are the nature-of-suit codes 310, 315, 320, 330, 340, 345, 350, 355, 360, 362, 365, 367, 368. A case counts in the fiscal year of its termination date, from fiscal 2010 through fiscal 2025. When the same case (district, office, docket number, filing date and origin) appears in more than one annual data file, we keep the record from the most recent file and use its termination date and fields; 27,372 duplicate records were dropped. We exclude cases with a multidistrict litigation (MDL) docket number, meaning any value other than blank or -8 (738,987) and cases whose origin code marks an MDL transfer or MDL case (171,552); 135,162 of the latter are asbestos cases in the Eastern District of Pennsylvania that carry no MDL number. The filter cannot catch every MDL case: before July 2016 the origin code had no value for cases filed directly in the MDL court, and thousands of such cases without an MDL number remain in the count, most of them product liability suits in the Southern District of Illinois. Of the remaining 406,396 terminations, we also leave out transfers to another district or MDL court (disposition codes 0 and 10, 60,977), remands to state court or a federal agency (26,121), bankruptcy stays (365) and statistical closings (10,616), which do not end a case. That leaves 308,317 final resolutions. A case that was reopened after it closed gets a new record with its own filing date and origin code, so a few thousand cases that ended twice in the period are counted once for each termination.
A plaintiff is without a lawyer when the pro se field shows at least one pro se plaintiff (PROSE 1 or 3); all other cases count as represented (PROSE 0 or 2). Settled is disposition code 13; dismissed by the court is DISP 2, 3, 14 (want of prosecution, lack of jurisdiction, other dismissal); judgment on a pretrial motion is code 6; trial verdicts are codes 7 to 9. Other judgments (default, consent, arbitration award and the codebook's other judgment) are shown separately. Counting only cases with an MDL docket number as MDL and treating the other-judgment code as a dismissal, the shares would be 63.9% versus 13.9% settled and 18.1% versus 62.8% dismissed, with the large asbestos group included.
To check our counts, we recounted the published fiscal 2025 totals of the U.S. Courts. For civil filings of all case types with a pro se party on either side (pro se codes 1 to 3, including cases where only a defendant was pro se), we count 90,841 against 89,971 in Table C-13, 1.0% higher. For motor vehicle personal injury terminations (codes 350 and 355) in diversity cases, we count 5,329 against 5,333 in Table C-4, 0.08% lower.
What this data cannot tell you
- The comparison shows an association, not the effect of hiring a lawyer. Lawyers decide which cases to take, so plaintiffs who sue on their own may include many whose claims no lawyer accepted. The records do not measure the strength of a claim or the size of the injury.
- The data cover federal district courts only. Injury claims filed in state courts and claims settled before any lawsuit are not included.
- The records do not show settlement amounts. The amount field is not used uniformly by the district courts, and the Administrative Office advises against analyzing it.
- The pro se field reflects the latest record of a case. The FJC notes that it may change over the life of a case and has no data quality control checks, so a plaintiff who had a lawyer for part of a case may be counted either way.
- The settled code is a lower bound: some voluntary dismissals and some dismissals on other grounds follow a private settlement that the record does not capture. Courts can still update records for cases that ended in fiscal 2025.
Frequently Asked Questions
Does hiring a lawyer increase your settlement?
Federal court records do not show settlement amounts, but they show how often cases settle. Of 284,080 federal injury cases with a plaintiff's lawyer, 56.8% settled, against 9.6% of 24,237 cases filed without one (FY2010–FY2025, outside multidistrict litigation). Lawyers pick their cases, so part of the gap reflects which cases they take.
Should I get a lawyer for a car accident?
In federal motor vehicle injury cases, 62.4% of plaintiffs with a lawyer settled, against 19.9% of plaintiffs without one, and courts dismissed 48.6% of the pro se cases. The data describe outcomes, not what any single case is worth.
Can you sue for personal injury without a lawyer?
Yes. Plaintiffs without a lawyer brought 24,237 federal injury cases that reached a final resolution outside multidistrict litigation in fiscal 2010 through 2025. Courts dismissed 59.0% of them, and another 17.1% ended in a judgment on a pretrial motion.
What percentage of personal injury cases settle?
In federal court, outside multidistrict litigation, 56.8% of represented injury cases were recorded as settled and another 16.6% were voluntarily dismissed, which sometimes follows a private settlement. Without a lawyer, 9.6% were settled.
How often do personal injury cases go to trial?
Rarely: 1.7% of represented federal injury cases and 0.6% of pro se cases ended in a trial verdict. Represented plaintiffs won 47.8% of verdicts with a recorded winner.
Why are injury cases without a lawyer dismissed so often?
The records give the type of dismissal, not the reason behind it. Courts dismissed 59.0% of pro se injury cases for want of prosecution, lack of jurisdiction or other grounds, against 18.3% of represented cases. The data cannot separate the effect of representation from differences between the cases themselves.
Sources
- Integrated Database (IDB), civil data file 1988 to present — Federal Judicial Center
- Integrated Data Base: Civil Documentation (codebook, 1988 forward) — Federal Judicial Center
- The Integrated Database: A Research Guide — Federal Judicial Center
- Table C-13: U.S. District Courts, Civil Pro Se and Non-Pro Se Filings, by District (12 months ending September 30, 2025) — Administrative Office of the U.S. Courts
- Table C-4: U.S. District Courts, Civil Cases Terminated, by Nature of Suit and Action Taken (12 months ending September 30, 2025) — Administrative Office of the U.S. Courts
- Civil Nature of Suit Code Descriptions — Administrative Office of the U.S. Courts
 Independent analysis. Settlement Insight is not a law firm and not affiliated with any agency named here. Analysis by Leonard Goldberg, Editor. How we work: methodology, our data.
More Research and Data
Other studies from our database of public legal records — each with free CSV downloads.
Related research
- Lawsuits Filed Without a LawyerHow many federal civil cases are filed pro se, by year and case type.
- How Product Liability Cases EndSettlements, dismissals and trial verdicts in federal product liability cases.
- Federal Lawsuit OutcomesSettlement and trial rates for all federal civil case types.
- Trucking and Delivery Crash LawsuitsWhich trucking and delivery companies face the most federal crash lawsuits.
Latest studies
- Clayton lenders in mobile home complaintsTwo Clayton Homes lenders account for 44.3% of CFPB manufactured home loan complaints
- Credit Card Interest ComplaintsSynchrony: 736 CFPB complaints about credit card interest in 2025, the most of any company
- Earned Wage Access ComplaintsDave leads: 65 of 1,177 CFPB earned wage access and advance complaints
- Gift Card Complaints by CompanyAmerican Express: 50.6% of CFPB gift card complaints in 2024–2025, the most of any company