How Often Federal Civil Forfeiture Cases End in a Default Judgment
Original analysis of 30,648 records from the Federal Judicial Center, FY2006–FY2025 (federal fiscal years). Published October 18, 2026.
We counted every federal civil forfeiture and penalty case brought by the United States and closed in fiscal 2006 through 2025, and how each one ended: default judgment, settlement, dismissal or trial.
What the Federal Court Records Show
Of 4,572 civil forfeiture and penalty cases filed by the United States and closed in federal district courts in fiscal years 2021 through 2025, 1,882 ended in a default judgment, or 41.2%. Only 15 ended in a trial verdict. In drug-related seizure cases alone the default share was 42.5%, and in cases where the first-listed defendant is property it was 43.9%.
- 41%Federal forfeiture cases ending in default, FY2021–25
- 15Trial verdicts among them, FY2021–25
- 44%Default share, property-named defendant, FY2021–25
Default is the most common outcome
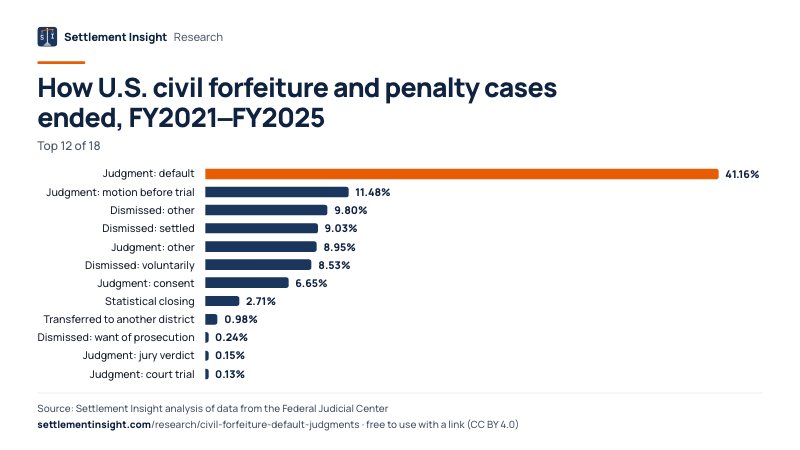
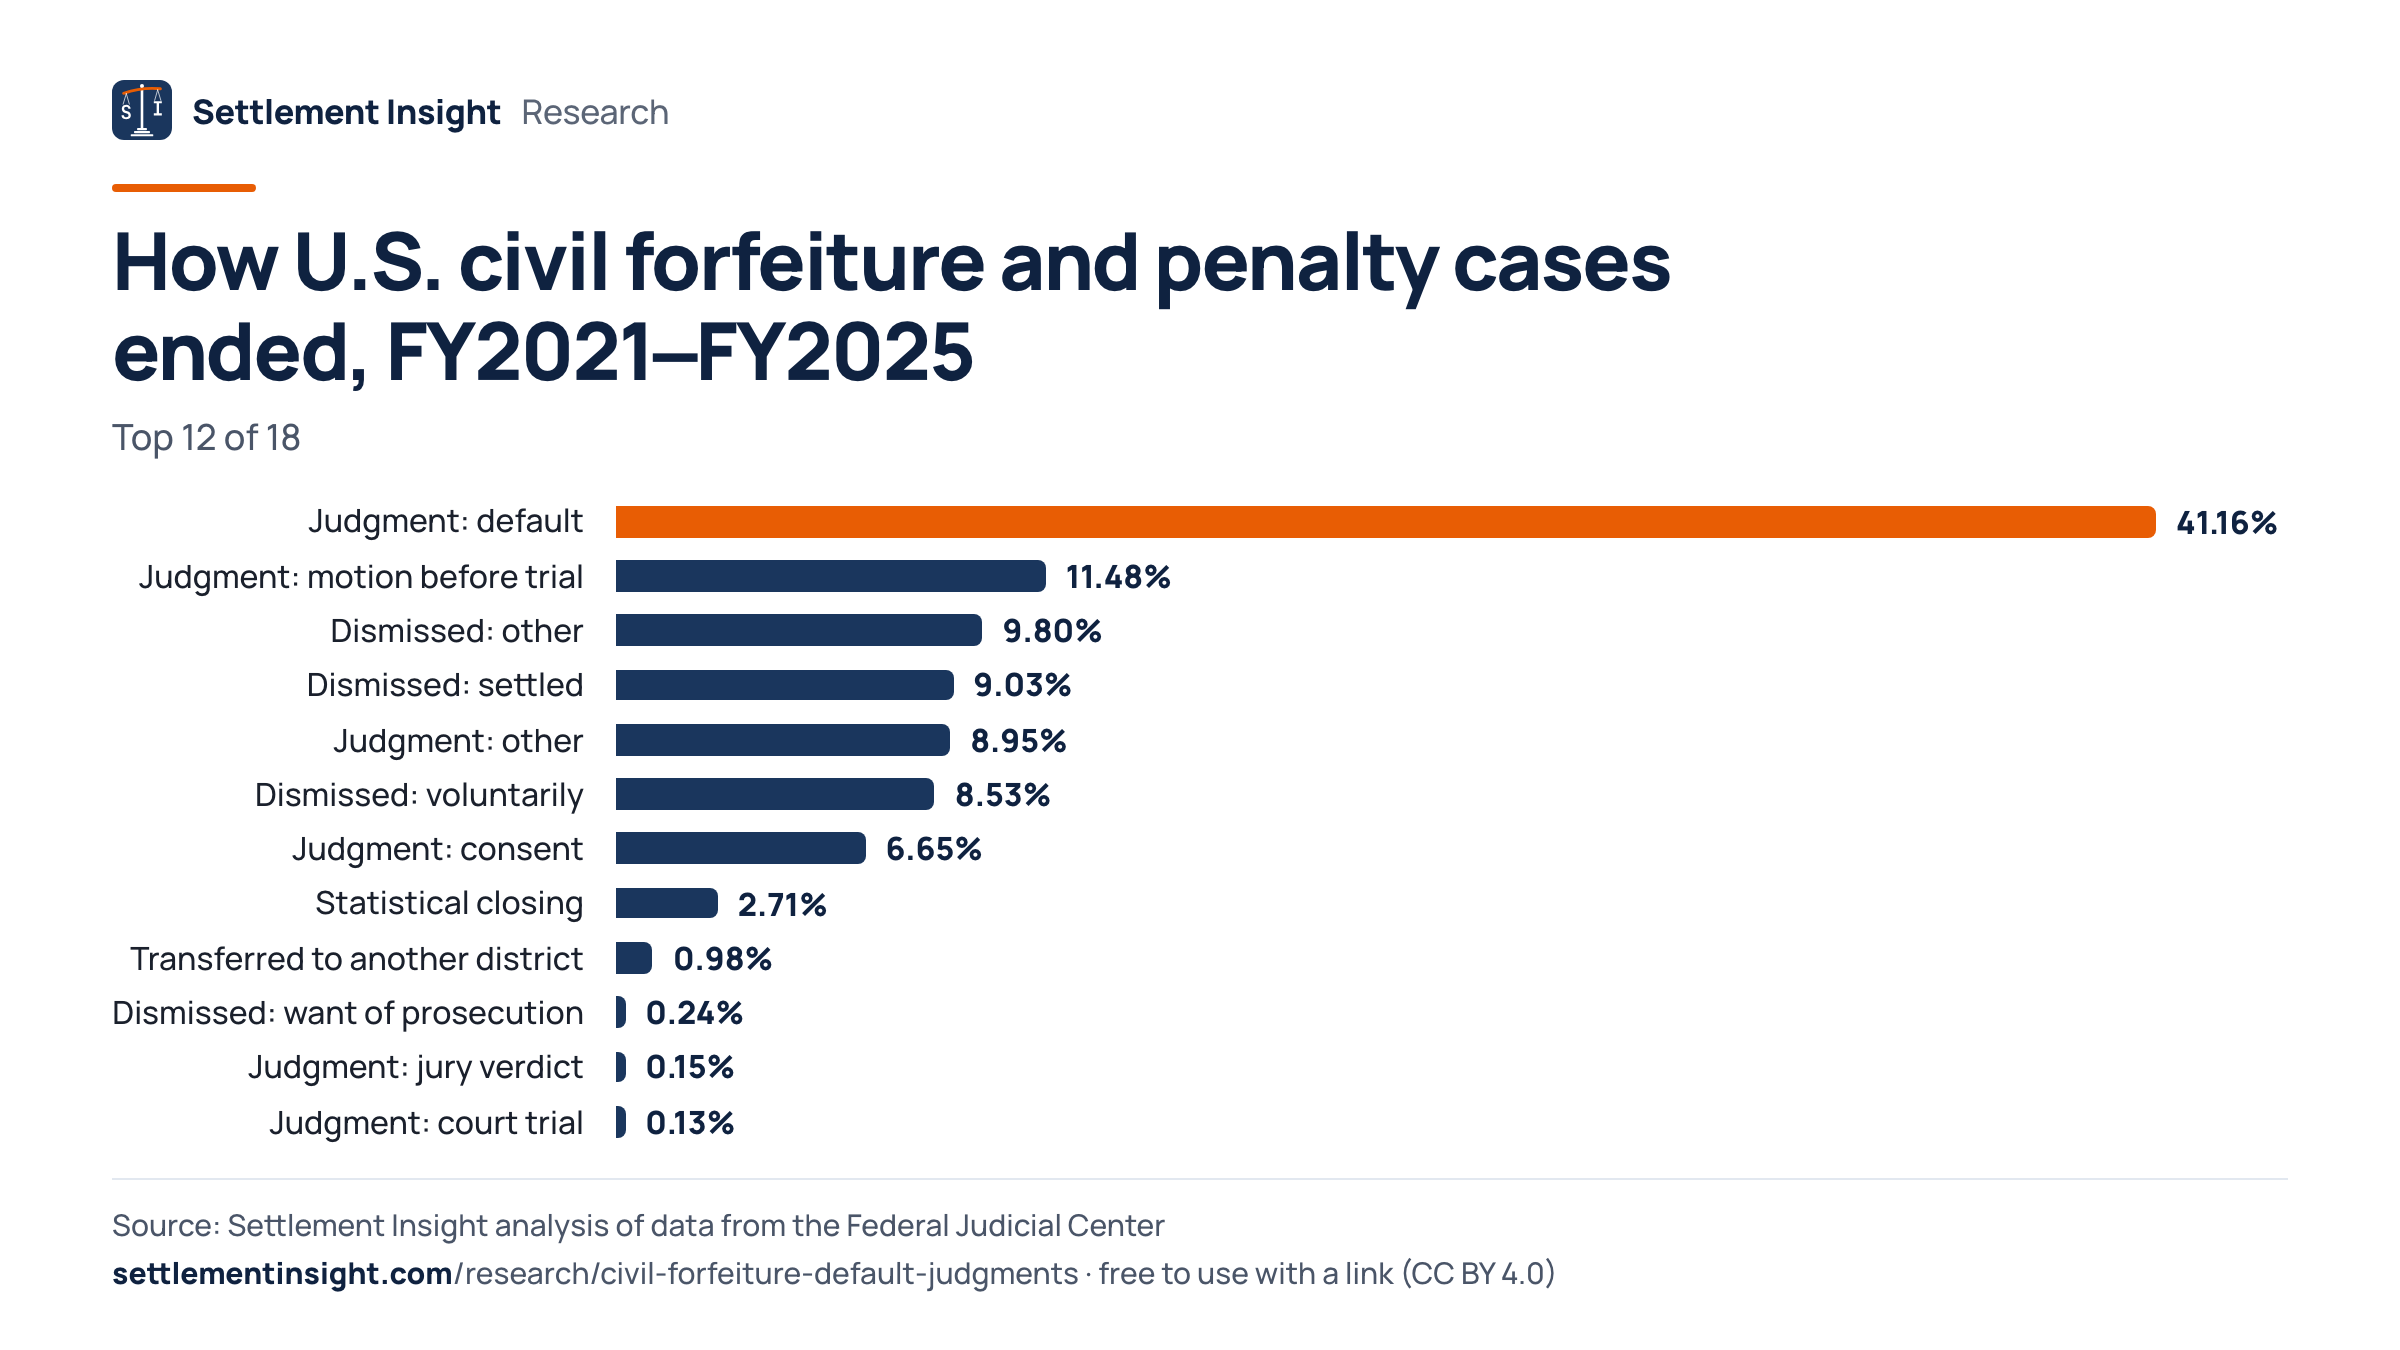
Default judgments accounted for 1,882 of 4,572 closed cases (41.2%), far ahead of judgments on a motion before trial (11.5%) and dismissals coded as settled (9.0%).
Trials are almost absent
Only 15 of the 4,572 cases ended in a jury verdict, directed verdict or bench trial, a share of 0.33%.
The default share has risen
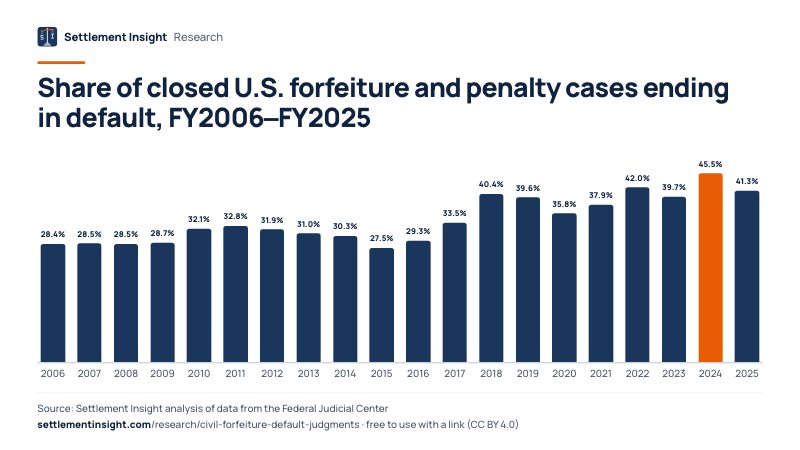
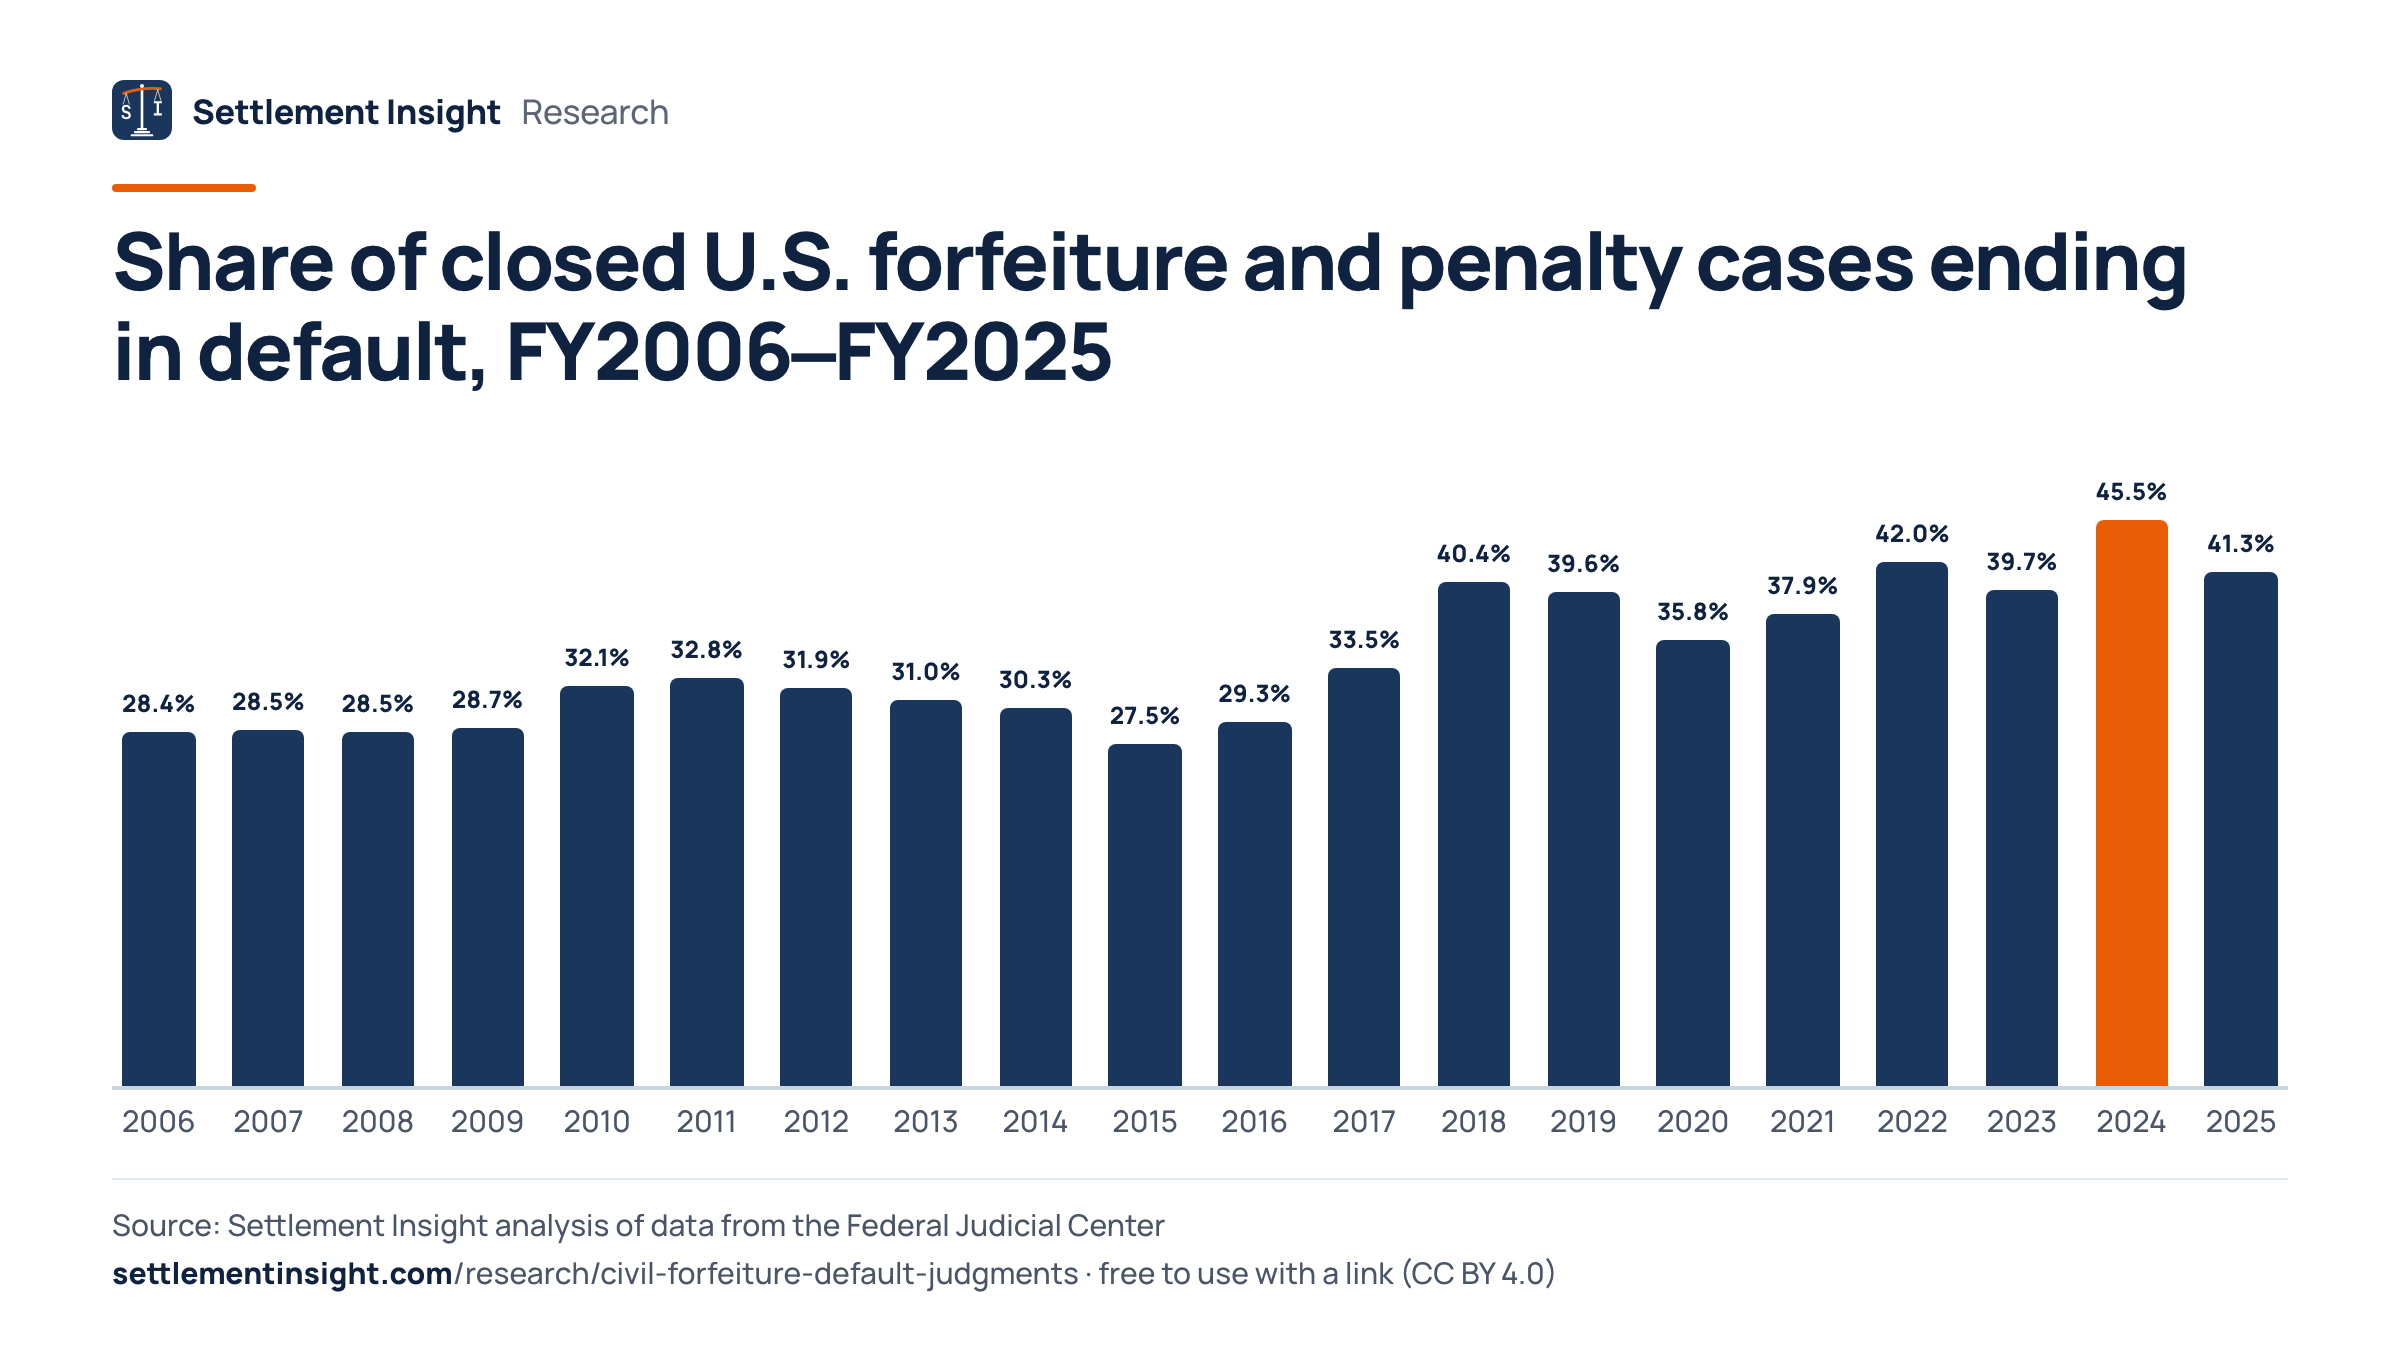
In fiscal 2006, 28.4% of closed cases ended in default; in fiscal 2025 it was 41.3%. The highest share in the series came in fiscal 2024 at 45.5%.
Fewer cases are closed each year
Courts closed an average of 2,129 of these cases a year in fiscal 2006–2010 and 914 a year in fiscal 2021–2025.
Districts differ widely
Among the 44 district courts with at least 40 closed cases, the default share ranged from 91.1% in the Western District of North Carolina to 1.5% in the Western District of Pennsylvania, a spread that may partly reflect how courts code uncontested cases.
How Federal Civil Forfeiture Cases End
Every closed federal case carries a disposition code. We counted the codes of all forfeiture and penalty cases the United States filed as plaintiff and that closed in fiscal years 2021 through 2025.
41.2% of the 4,572 closed cases ended in a default judgment, 11.5% in a judgment on a motion before trial, 6.6% in a consent judgment and 0.33% in a trial verdict.
In a civil forfeiture case the Justice Department describes the roles this way: "the government is the plaintiff, the property is considered the defendant, and any person who claims an interest in the property is a claimant." Under Supplemental Rule G, the government's notice must give potential claimants "a deadline for filing a claim, at least 35 days after the notice is sent." When no claim is filed, the court can enter a default judgment.
The FJC codebook defines a default disposition as one "disposed of by a default judgment entered by the court or the clerk of court pursuant to Rule 55". By that code, default judgments ended 1,882 of the 4,572 cases. Consent judgments, which are agreed to by all parties, ended 6.6%, and dismissals coded as settled another 9.0%.
The default share is a lower bound for uncontested cases. Some courts record the final forfeiture order as a judgment on a motion (11.5% of all cases) or as another kind of judgment (8.9%), and the records do not say whether a claimant ever appeared.
How U.S. civil forfeiture and penalty cases ended, FY2021–FY2025
- Judgment: default41.16%1,882 cases
- Judgment: motion before trial11.48%525 cases
- Dismissed: other9.80%448 cases
- Dismissed: settled9.03%413 cases
- Judgment: other8.95%409 cases
- Dismissed: voluntarily8.53%390 cases
- Judgment: consent6.65%304 cases
- Statistical closing2.71%124 cases
All outcomes
- Transferred to another district0.98%45 cases
- Dismissed: want of prosecution0.24%11 cases
- Judgment: jury verdict0.15%7 cases
- Judgment: court trial0.13%6 cases
- Dismissed: lack of jurisdiction0.04%2 cases
- Judgment: directed verdict0.04%2 cases
- Remanded to state court0.02%1 case
- Award of arbitrator0.02%1 case
- Stayed pending bankruptcy0.02%1 case
- Appeal affirmed (magistrate judge)0.02%1 case
Fiscal years run October through September. Cases are counted in the year they were closed.
Is the Civil Forfeiture Default Rate Rising
The chart shows, for each fiscal year, the share of closed U.S. forfeiture and penalty cases that ended in a default judgment.
The default share went from 28.4% in fiscal 2006 to 41.3% in fiscal 2025, while the number of closed cases went from 2,009 to 797.
Over the first five fiscal years of the series, fiscal 2006 through 2010, 29.3% of 10,644 closed cases ended in default. Over fiscal 2021 through 2025 it was 41.2% of 4,572. The highest share came in fiscal 2024, at 45.5%.
The caseload fell at the same time. The court records cannot show why; they cover only forfeitures litigated in court, not administrative forfeitures, which the Justice Department describes as forfeitures "without filing a case in federal court" when "no one has filed a claim contesting the seizure." Trial verdicts went from 61 in fiscal 2006–2010 to 15 in fiscal 2021–2025.
Share of closed U.S. forfeiture and penalty cases ending in default, FY2006–FY2025
- FY200628.4%571 of 2,009 cases
- FY200728.5%604 of 2,116 cases
- FY200828.5%583 of 2,048 cases
- FY200928.7%660 of 2,299 cases
- FY201032.1%698 of 2,172 cases
- FY201132.8%680 of 2,076 cases
- FY201231.9%660 of 2,071 cases
- FY201331.0%655 of 2,110 cases
- FY201430.3%580 of 1,912 cases
- FY201527.5%501 of 1,820 cases
- FY201629.3%369 of 1,261 cases
- FY201733.5%339 of 1,011 cases
- FY201840.4%469 of 1,161 cases
- FY201939.6%412 of 1,040 cases
- FY202035.8%347 of 970 cases
All 20 fiscal years
- FY202137.9%370 of 977 cases
- FY202242.0%453 of 1,078 cases
- FY202339.7%362 of 911 cases
- FY202445.5%368 of 809 cases
- FY202541.3%329 of 797 cases
Fiscal 2026 is incomplete in the FJC file and is not shown.
Drug Seizure Cases Compared With Other Forfeiture Suits
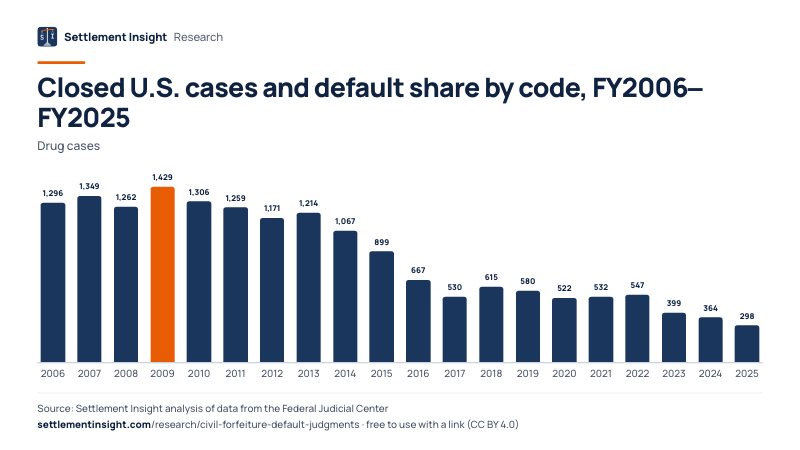
The judiciary sorts these cases into two codes: drug-related seizure of property and other forfeiture and penalty suits. The second code also covers civil penalty suits against people and companies.
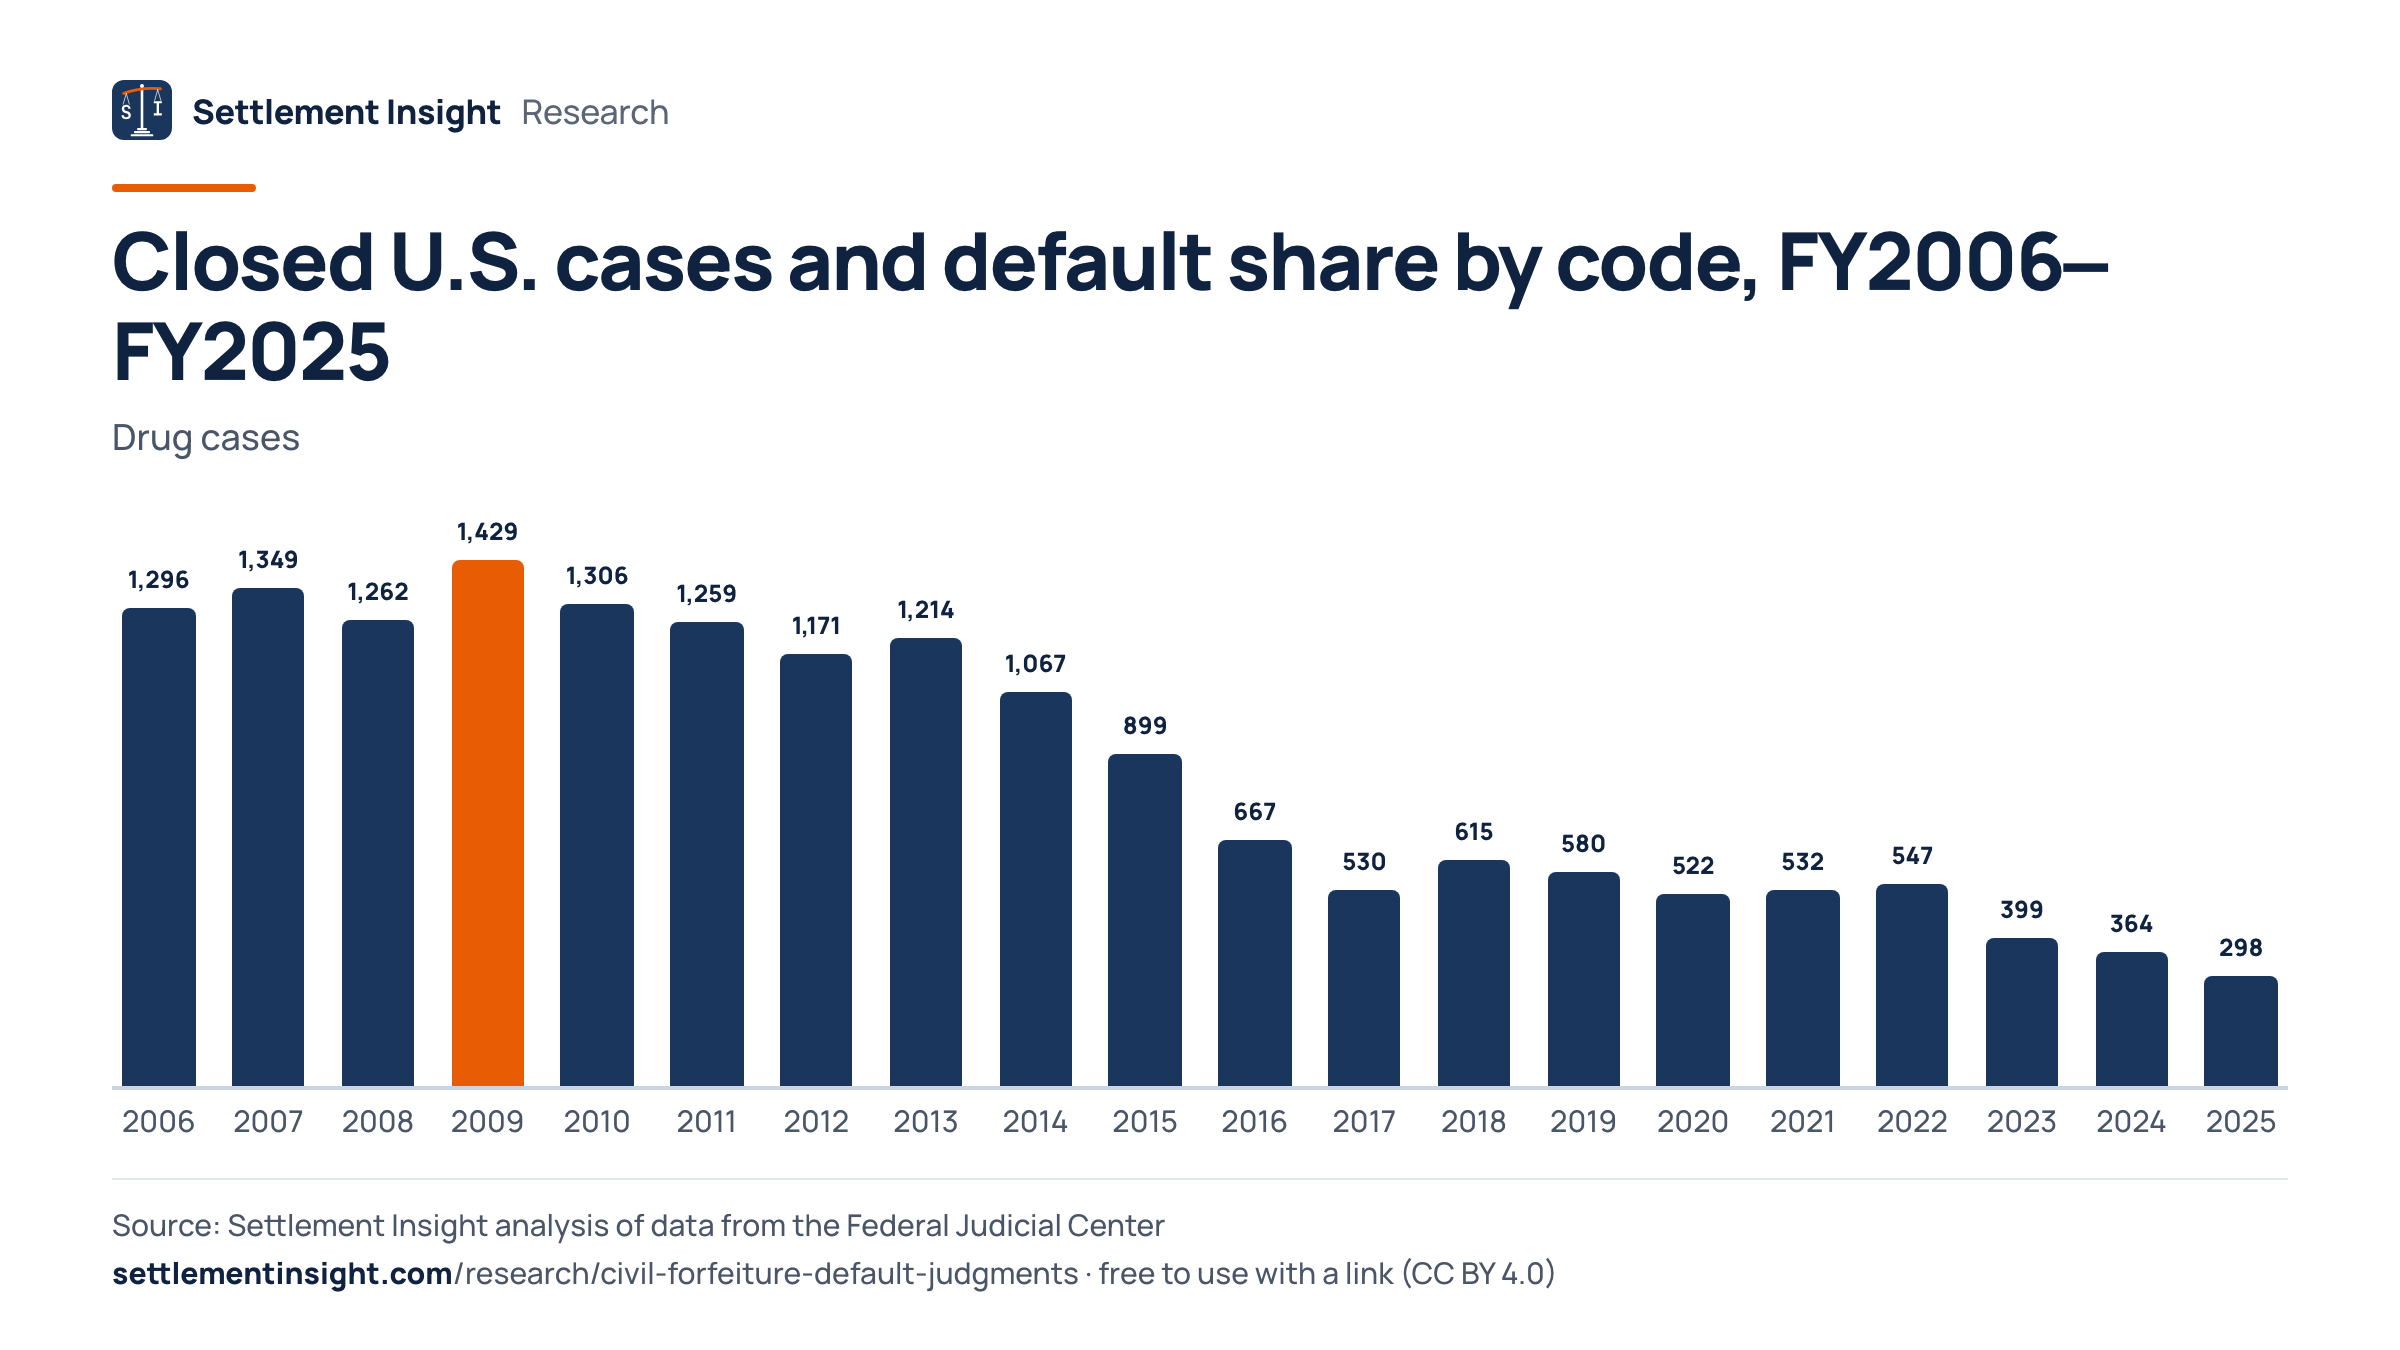
In fiscal 2021–2025, 42.5% of 2,140 drug-related seizure cases and 40.0% of 2,432 other forfeiture and penalty cases ended in default.
Drug-related seizure cases are, in the words of the judiciary's code descriptions, an "Action (Forfeiture) by which property itself is accused of wrongdoing". The other code is a catch-all for actions that "cannot be classified under any other nature of suit", including penalty suits.
To separate forfeitures from penalty suits, we checked whether the first-listed defendant names property: a sum of money, currency, an account, real estate, a vehicle, a firearm or similar. That was the case for 4,013 of the 4,572 cases (87.8%), and 43.9% of them ended in default. The remaining 559 cases, most of them suits against named people or companies, ended in default 21.8% of the time.
Closed U.S. cases and default share by code, FY2006–FY2025
| Year | Drug cases | Default | Other cases | Default |
|---|---|---|---|---|
| FY2006 | 1,296 | 30.2% | 713 | 25.1% |
| FY2007 | 1,349 | 28.2% | 767 | 29.1% |
| FY2008 | 1,262 | 30.1% | 786 | 25.8% |
| FY2009 | 1,429 | 29.5% | 870 | 27.4% |
| FY2010 | 1,306 | 32.7% | 866 | 31.3% |
| FY2011 | 1,259 | 34.9% | 817 | 29.5% |
| FY2012 | 1,171 | 32.8% | 900 | 30.7% |
| FY2013 | 1,214 | 32.0% | 896 | 29.7% |
| FY2014 | 1,067 | 32.2% | 845 | 27.9% |
| FY2015 | 899 | 30.6% | 921 | 24.5% |
All 20 fiscal years
| Year | Drug cases | Default | Other cases | Default |
|---|---|---|---|---|
| FY2016 | 667 | 32.4% | 594 | 25.8% |
| FY2017 | 530 | 34.2% | 481 | 32.8% |
| FY2018 | 615 | 39.7% | 546 | 41.2% |
| FY2019 | 580 | 40.3% | 460 | 38.7% |
| FY2020 | 522 | 39.7% | 448 | 31.3% |
| FY2021 | 532 | 38.0% | 445 | 37.8% |
| FY2022 | 547 | 42.2% | 531 | 41.8% |
| FY2023 | 399 | 42.1% | 512 | 37.9% |
| FY2024 | 364 | 47.8% | 445 | 43.6% |
| FY2025 | 298 | 45.3% | 499 | 38.9% |
Which Federal Courts Enter the Most Forfeiture Default Judgments
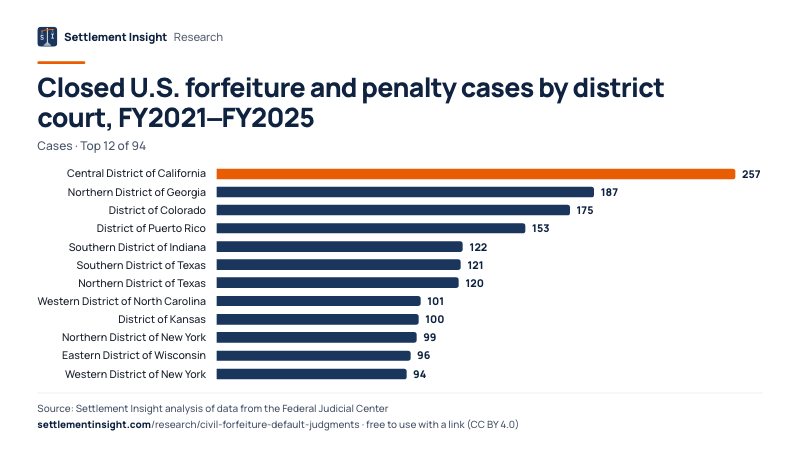
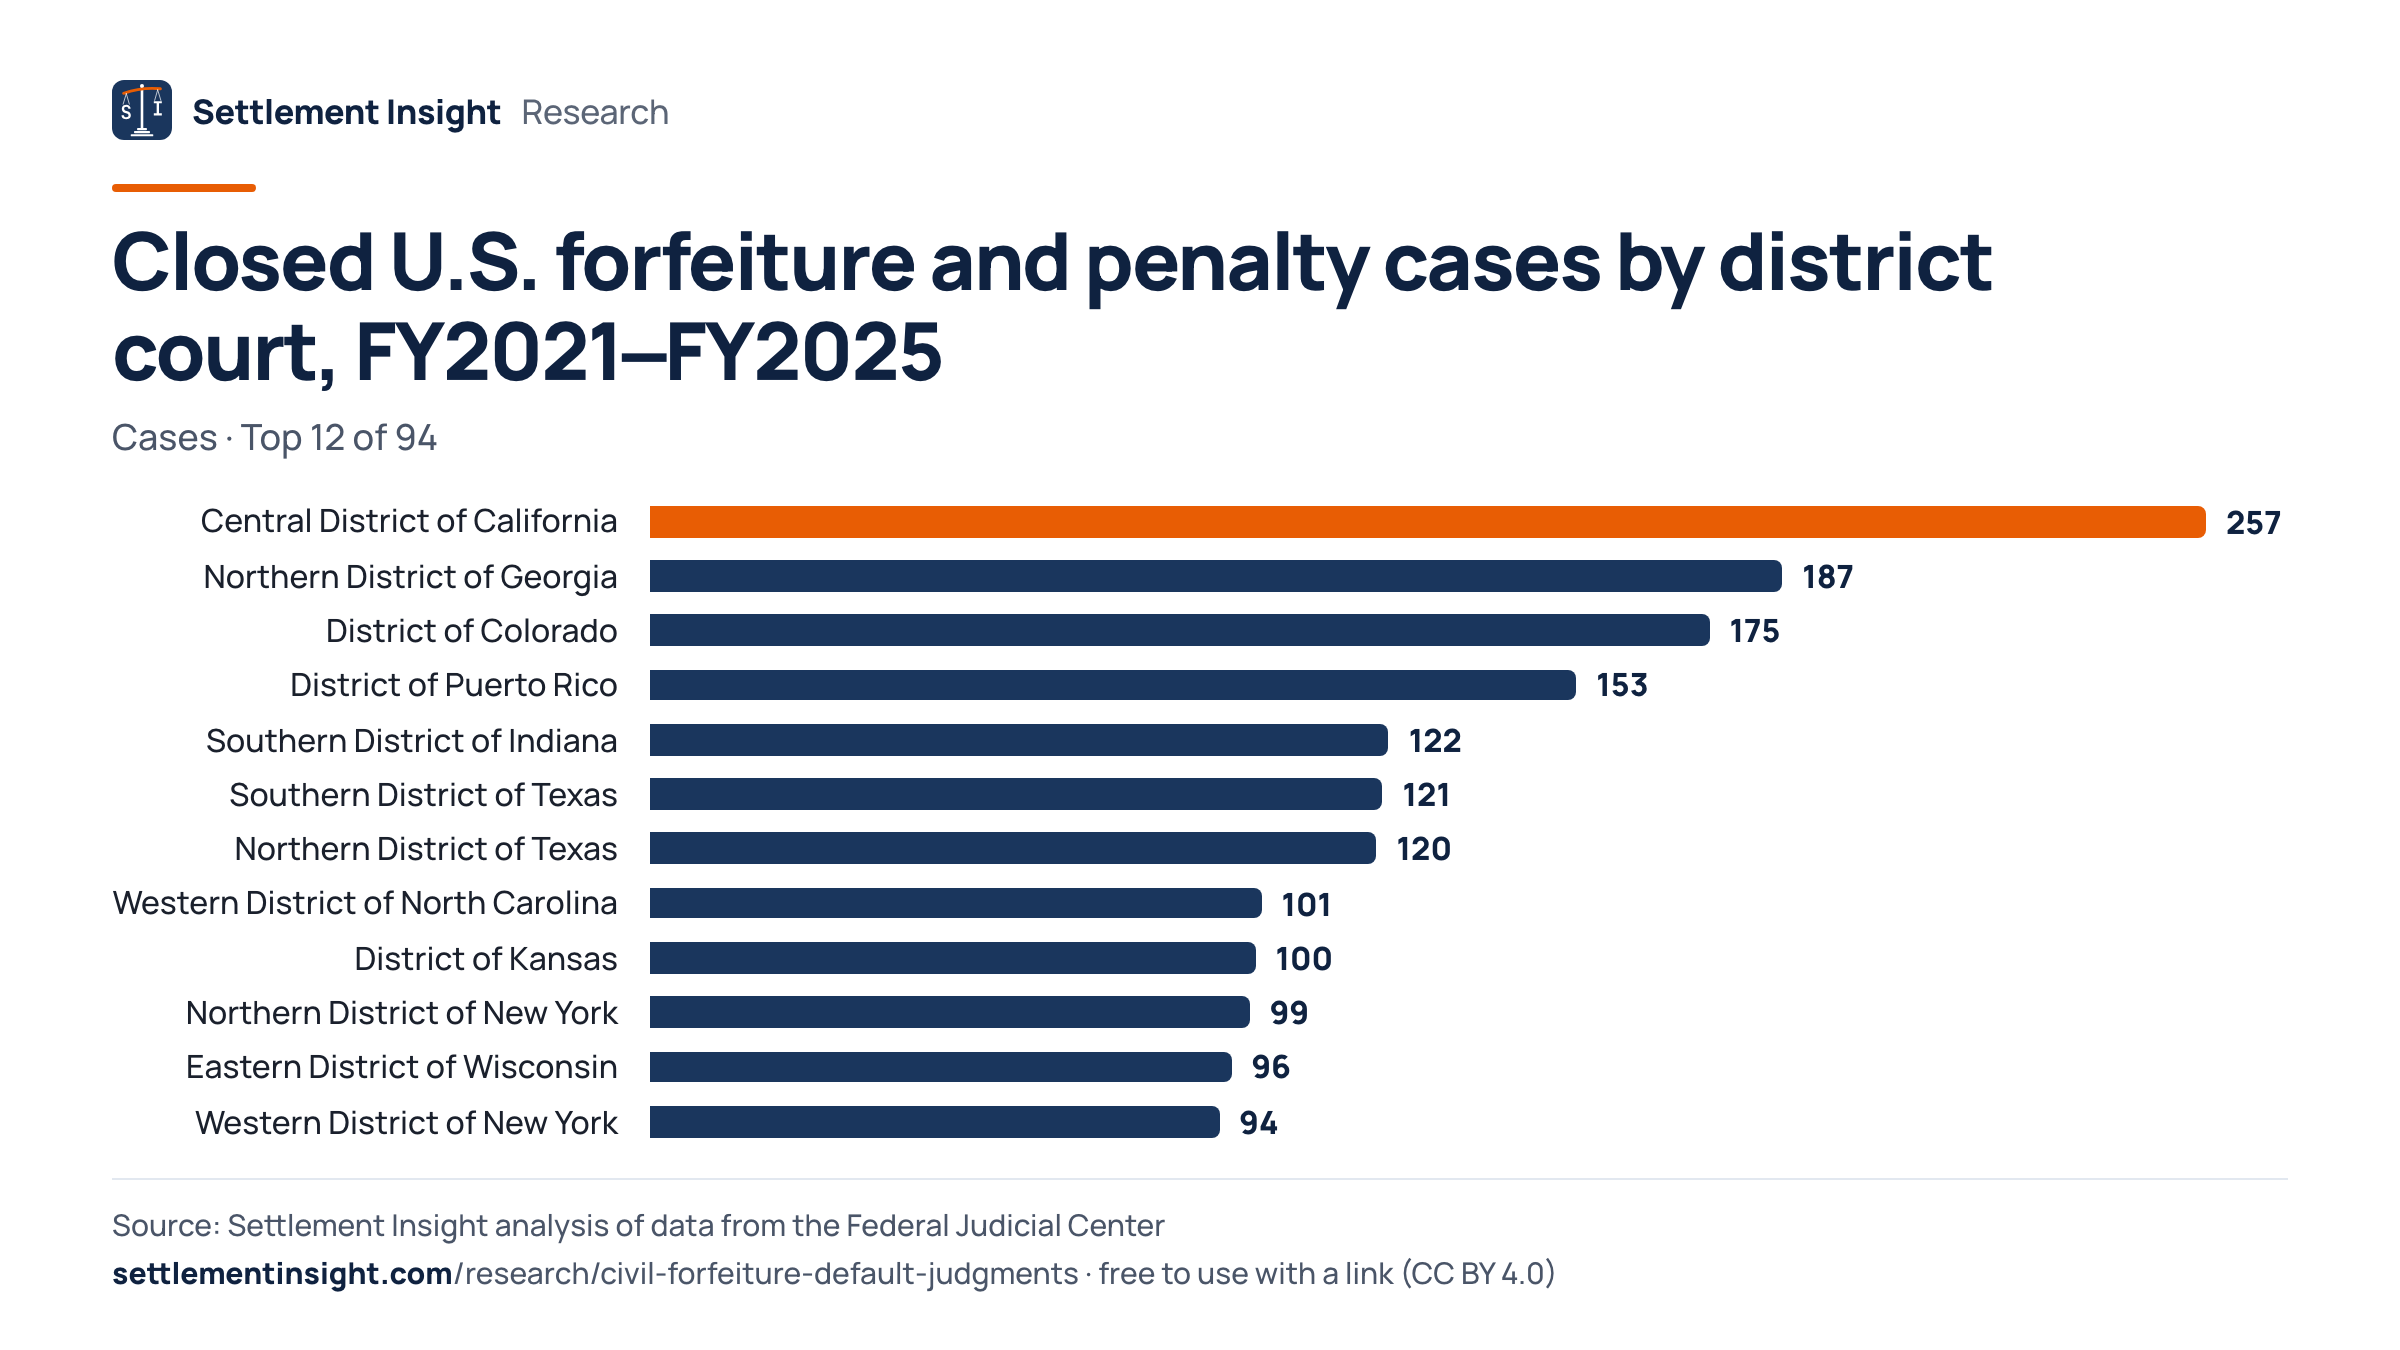
The table lists federal district courts by the number of U.S. forfeiture and penalty cases they closed in fiscal 2021–2025, with the share that ended in a default judgment.
The Central District of California closed the most cases (257), 23.3% of them by default. Among courts with at least 40 cases, the share ranged from 91.1% to 1.5%.
The five busiest district courts account for 19.6% of all closed cases. Case counts reflect where the government files, not the size of a district's population.
The spread between courts is large: 91.1% of 101 cases in the Western District of North Carolina ended in default, against 1.5% of 68 in the Western District of Pennsylvania. Part of this spread likely reflects recording practice. Some courts close uncontested forfeitures with an order coded as a judgment on a motion or as another judgment rather than as a default, so a low default share does not by itself mean more owners contested.
Closed U.S. forfeiture and penalty cases by district court, FY2021–FY2025
| District | Cases | Default |
|---|---|---|
| Central District of California | 257 | 23.3% |
| Northern District of Georgia | 187 | 52.9% |
| District of Colorado | 175 | 32.6% |
| District of Puerto Rico | 153 | 43.8% |
| Southern District of Indiana | 122 | 73.0% |
| Southern District of Texas | 121 | 37.2% |
| Northern District of Texas | 120 | 40.8% |
| Western District of North Carolina | 101 | 91.1% |
| District of Kansas | 100 | 67.0% |
| Northern District of New York | 99 | 32.3% |
| Eastern District of Wisconsin | 96 | 61.5% |
| Western District of New York | 94 | 38.3% |
| District of New Mexico | 92 | 53.3% |
| District of South Carolina | 92 | 51.1% |
| District of Connecticut | 90 | 25.6% |
All 94 districts
| District | Cases | Default |
|---|---|---|
| Eastern District of Michigan | 85 | 47.1% |
| Southern District of New York | 82 | 3.7% |
| Western District of Texas | 80 | 25.0% |
| District of Arizona | 78 | 65.4% |
| District of Oregon | 77 | 58.4% |
| Eastern District of North Carolina | 73 | 60.3% |
| District of Nevada | 72 | 9.7% |
| Western District of Pennsylvania | 68 | 1.5% |
| Western District of Missouri | 66 | 53.0% |
| Eastern District of Kentucky | 65 | 35.4% |
| Eastern District of Texas | 65 | 32.3% |
| Middle District of Florida | 58 | 22.4% |
| Middle District of North Carolina | 58 | 20.7% |
| Southern District of Mississippi | 57 | 66.7% |
| Western District of Tennessee | 57 | 52.6% |
| Northern District of Indiana | 56 | 37.5% |
| Southern District of Iowa | 55 | 74.5% |
| Northern District of Ohio | 53 | 26.4% |
| Middle District of Tennessee | 50 | 42.0% |
| Northern District of Illinois | 50 | 24.0% |
| Southern District of Florida | 50 | 38.0% |
| Southern District of Illinois | 49 | 36.7% |
| Eastern District of California | 47 | 19.1% |
| Southern District of Ohio | 46 | 37.0% |
| District of Maryland | 44 | 61.4% |
| District of Columbia | 42 | 35.7% |
| District of New Jersey | 42 | 26.2% |
| District of Minnesota | 41 | 65.9% |
| District of Massachusetts | 40 | 22.5% |
| Eastern District of Tennessee | 38 | 21.1% |
| Middle District of Alabama | 37 | 29.7% |
| Northern District of California | 37 | 13.5% |
| Southern District of Georgia | 37 | 27.0% |
| Southern District of West Virginia | 36 | 30.6% |
| Central District of Illinois | 33 | 30.3% |
| District of New Hampshire | 32 | 0.0% |
| Eastern District of New York | 32 | 43.8% |
| Eastern District of Missouri | 30 | 46.7% |
| Middle District of Georgia | 30 | 50.0% |
| Western District of Washington | 30 | 46.7% |
| Northern District of Florida | 29 | 17.2% |
| Western District of Michigan | 29 | 75.9% |
| Northern District of Mississippi | 27 | 44.4% |
| Western District of Arkansas | 26 | 26.9% |
| Western District of Kentucky | 26 | 76.9% |
| Eastern District of Virginia | 24 | 37.5% |
| Middle District of Louisiana | 24 | 33.3% |
| Western District of Wisconsin | 24 | 70.8% |
| Middle District of Pennsylvania | 23 | 34.8% |
| District of Nebraska | 22 | 40.9% |
| District of Utah | 22 | 40.9% |
| District of Rhode Island | 19 | 47.4% |
| Northern District of Alabama | 19 | 47.4% |
| District of Delaware | 17 | 35.3% |
| Eastern District of Pennsylvania | 17 | 5.9% |
| Eastern District of Washington | 17 | 70.6% |
| District of Alaska | 16 | 43.8% |
| District of Vermont | 16 | 68.8% |
| Western District of Virginia | 16 | 75.0% |
| Eastern District of Louisiana | 15 | 46.7% |
| Western District of Louisiana | 15 | 0.0% |
| District of Maine | 14 | 35.7% |
| District of Montana | 14 | 50.0% |
| Eastern District of Arkansas | 14 | 14.3% |
| Western District of Oklahoma | 14 | 42.9% |
| Northern District of Iowa | 12 | 83.3% |
| Southern District of California | 11 | 18.2% |
| Northern District of Oklahoma | 10 | 40.0% |
| Southern District of Alabama | 10 | 10.0% |
| District of Hawaii | 9 | 44.4% |
| Northern District of West Virginia | 9 | 11.1% |
| District of Idaho | 6 | 16.7% |
| District of North Dakota | 6 | 66.7% |
| Eastern District of Oklahoma | 6 | 50.0% |
| District of Virgin Islands | 5 | 40.0% |
| District of Wyoming | 5 | 20.0% |
| District of South Dakota | 4 | 50.0% |
| District of Northern Mariana Islands | 2 | 0.0% |
| District of Guam | 1 | 0.0% |
Cases are U.S.-plaintiff cases under both forfeiture and penalty codes, counted in the court that closed them.
Download the Data and Cite This Study
Every table as a CSV file and in one Excel workbook, a short PDF summary and every chart as an image, free to reuse with attribution (CC BY 4.0).
- Default judgments in federal civil forfeiture and penalty cases by district court, FY2021–FY2025Terminations of natures of suit 625 and 690 with the United States as plaintiff by district court, fiscal years 2021 through 2025; in_ranking marks districts with at least 40 terminations. · 94 rows · CSV, 5 KB
- Federal civil forfeiture and penalty cases filed by the U.S.: default judgments by fiscal year, FY2006–FY2025Terminations of natures of suit 625 and 690 with the United States as plaintiff, by fiscal year of termination, with the number and share ending in a default judgment and the number of trial verdicts. · 20 rows · CSV, 1 KB
- How federal civil forfeiture and penalty cases filed by the U.S. ended, FY2021–FY2025Terminations of natures of suit 625 and 690 with the United States as plaintiff in fiscal years 2021 through 2025, by FJC disposition code. · 18 rows · CSV, 1 KB
- All tables in one Excel workbookOne sheet per table plus an About sheet with sources, method and citation · Excel (.xlsx), 16 KB
- Summary to print or forward (3 pages)Short answer, key figures, main chart, findings, method and citation · PDF, 250 KB
Charts for your story
How U.S. civil forfeiture and penalty cases ended, FY2021–FY2025
Embed this chart
Share of closed U.S. forfeiture and penalty cases ending in default, FY2006–FY2025
Embed this chart
Closed U.S. cases and default share by code, FY2006–FY2025
Embed this chart
Closed U.S. forfeiture and penalty cases by district court, FY2021–FY2025
Embed this chart
How to cite
Goldberg, L. (2026). Federal Civil Forfeiture Default Judgments — U.S.-plaintiff forfeiture and penalty cases by outcome, fiscal year and district (FY2006–FY2025) [Data set]. Settlement Insight. https://settlementinsight.com/research/civil-forfeiture-default-judgments
BibTeX
@dataset{goldberg_2026_civil_forfeiture_default_judgments,
  author    = {Goldberg, Leonard},
  title     = {Federal Civil Forfeiture Default Judgments --- U.S.-plaintiff forfeiture and penalty cases by outcome, fiscal year and district (FY2006--FY2025)},
  year      = {2026},
  publisher = {Settlement Insight},
  url       = {https://settlementinsight.com/research/civil-forfeiture-default-judgments}
}How We Measured
Checked against published figures
- FY2025 civil filings with the U.S. as plaintiff, nature of suit 625 (Drug-Related Seizure of Property): published 251, our count 250 (0.40% apart).Table C-2: U.S. District Courts, Civil Cases Commenced, by Basis of Jurisdiction and Nature of Suit, 12 months ending September 30, 2025 (Judicial Business 2025)
- FY2025 civil filings with the U.S. as plaintiff, nature of suit 690 (Other Forfeiture and Penalty Suits): published 480, our count 476 (0.83% apart).Table C-2: U.S. District Courts, Civil Cases Commenced, by Basis of Jurisdiction and Nature of Suit, 12 months ending September 30, 2025 (Judicial Business 2025)
- FY2025 terminations of U.S. civil forfeiture and penalty cases (natures of suit 625 and 690, U.S. plaintiff or defendant): published 838, our count 838 (exact match).Table C-4: U.S. District Courts, Civil Cases Terminated, by Nature of Suit and Action Taken, 12 months ending September 30, 2025 (Judicial Business 2025)
Full method and limits of the data
We included cases under the two nature-of-suit codes the judiciary groups as forfeiture and penalty suits, 625 (drug related seizure of property) and 690 (other forfeiture and penalty suits), with the U.S. government as plaintiff. Suits in which the government is the defendant, such as owners suing to get property back, are left out. Years are federal fiscal years (October through September) of the date a case was closed, fiscal 2006 through fiscal 2025; fiscal 2026 is incomplete and left out.
The unit is a case closing, as in the judiciary's Table C-4. Default judgment means disposition code 4; trial verdicts are codes 7, 8 and 9 (jury verdict, directed verdict, court trial). The analysis covers 30,648 closings in fiscal 2006–2025, 4,572 of them in fiscal 2021–2025.
To check the data, we recounted published totals. For fiscal 2025 we count 250 drug-related seizure filings with the U.S. as plaintiff against 251 in Table C-2 (0.4% difference), 476 other forfeiture and penalty filings against 480 (0.8%), and 838 closings of forfeiture and penalty cases with the U.S. as plaintiff or defendant against 838 in Table C-4 (0.0% difference).
What this data cannot tell you
- A default judgment is recorded under one code, but courts do not all use it the same way. Some enter uncontested forfeitures as judgments on a motion or as other judgments, so the default share is a lower bound for uncontested cases and district comparisons partly reflect recording practice. The records do not say whether any claimant appeared, how much property was involved or whether property was returned.
- Court cases are only part of federal forfeiture. Administrative forfeitures, which happen at the seizing agency when no claim is filed, and criminal forfeitures do not appear in these civil records.
- The other forfeiture and penalty code also includes civil penalty suits against people and companies. Our property-caption check reads only the first-listed defendant in a truncated name field and is an approximation.
- A reopened case that closes again counts again: 92 docket numbers account for 187 of the closings in fiscal 2021–2025. Courts can also report cases late, so counts for fiscal 2025 may still change slightly in later FJC releases.
Frequently Asked Questions
How often is civil forfeiture contested in federal court?
Of 4,572 civil forfeiture and penalty cases the United States filed and that closed in fiscal 2021–2025, 41.2% ended in a default judgment, meaning judgment was entered because no one defended the case in time; some courts record uncontested forfeitures under other codes, so this is a lower bound for uncontested cases. Only 15 reached a trial verdict.
What is a default judgment in a civil forfeiture case?
In civil forfeiture the property itself is the defendant, and anyone claiming it must file a claim by the deadline in the government's notice. If no one does, the court can enter a default judgment, which the FJC records as a separate disposition code.
How many federal civil forfeiture cases go to trial?
Very few. Of the 4,572 U.S. forfeiture and penalty cases closed in fiscal 2021–2025, 15 ended in a jury verdict, directed verdict or bench trial, or 0.33%.
How many civil forfeiture cases are filed in federal court each year?
In fiscal 2025 the judiciary counted 251 drug-related seizure filings and 480 other forfeiture and penalty filings with the U.S. as plaintiff. Federal courts closed 797 forfeiture and penalty cases filed by the U.S. that year, down from 2,009 in fiscal 2006.
Do these numbers include administrative forfeitures?
No. Administrative forfeitures happen at the seizing agency without a court case when no claim is filed, so they are not in federal court records. These figures cover only civil forfeiture and penalty cases litigated in federal district courts.
Sources
- Integrated Database (IDB) — Federal Judicial Center
- Integrated Data Base: Civil Documentation (codebook, 1988 forward) — Federal Judicial Center
- Table C-2: U.S. District Courts, Civil Cases Commenced, by Basis of Jurisdiction and Nature of Suit (Judicial Business 2025) — Administrative Office of the U.S. Courts
- Table C-4: U.S. District Courts, Civil Cases Terminated, by Nature of Suit and Action Taken (Judicial Business 2025) — Administrative Office of the U.S. Courts
- Civil Nature of Suit Code Descriptions — Administrative Office of the U.S. Courts
- Supplemental Rule G: Forfeiture Actions in Rem — Legal Information Institute, Cornell Law School
- Types of Federal Forfeiture — U.S. Department of Justice
 Independent analysis. Settlement Insight is not a law firm and not affiliated with any agency named here. Analysis by Leonard Goldberg, Editor. How we work: methodology, our data.
More Research and Data
Other studies from our database of public legal records — each with free CSV downloads.
Related research
Latest studies
- GLP-1 Lawsuits by Maker83.0% of GLP-1 injury cases filed through June 2026 name Novo Nordisk, not Eli Lilly, as first defendant
- Most-sued companies in antitrustGoodRx: first-listed defendant in 30 new federal antitrust lawsuits in FY2025
- Who files pay-per-view piracy suitsJoe Hand Promotions filed 49.2% of new federal cable/satellite piracy suits in FY2025
- RICO lawsuits and insulin pricing28.3% of federal civil RICO filings in fiscal 2025 were insulin pricing cases