Schedule A Lawsuits: What Share of Federal Trademark Cases They Make Up
Original analysis of 43,077 records from the Federal Judicial Center, FY2013–FY2025. Published October 22, 2026.
We classified every federal trademark case filed from fiscal 2013 through fiscal 2025 by its defendant caption, counting the suits brought against sellers listed only on a "Schedule A" to the complaint.
Schedule A Cases in Federal Trademark Litigation
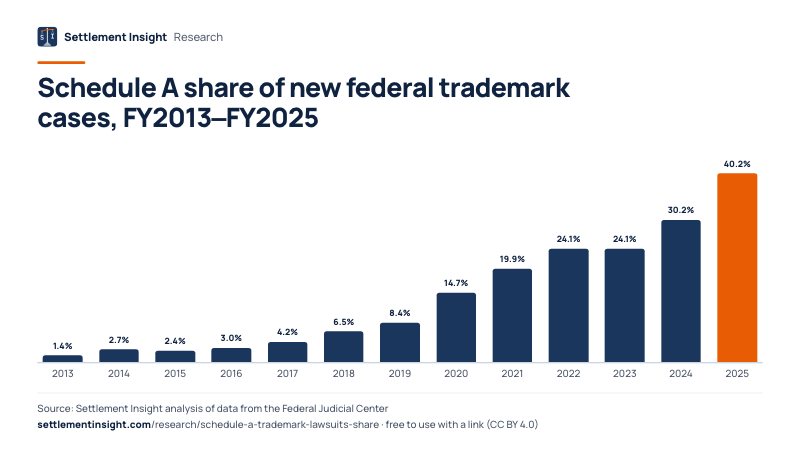
Schedule A cases accounted for 40.2% of all new federal trademark lawsuits in fiscal 2025: 1,653 of 4,117 cases, up from 1.4% in fiscal 2013. The Northern District of Illinois received 85.6% of them. The count is a lower bound, because it includes only cases whose public caption names the Schedule A defendants.
- 40%Schedule A share of new trademark cases, FY2025 (minimum)
- 1,653Schedule A trademark cases filed in FY2025
- 86%Of those, filed in the Northern District of Illinois
Two in five trademark suits
In fiscal 2025, 1,653 of 4,117 new federal trademark cases named Schedule A defendants in the caption, a share of 40.2%. In fiscal 2024 the share was 30.2%.
Most of the recent growth
New trademark cases rose by 860 from fiscal 2024 to fiscal 2025. Schedule A cases rose by 668, or 77.7% of that increase.
Concentrated in Chicago
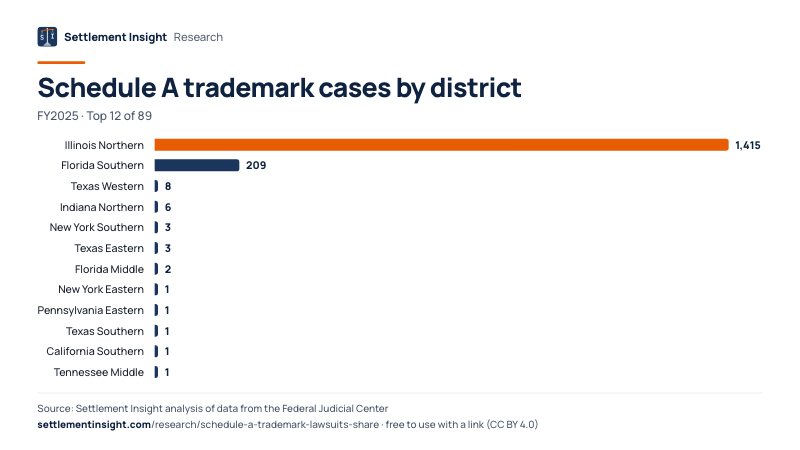
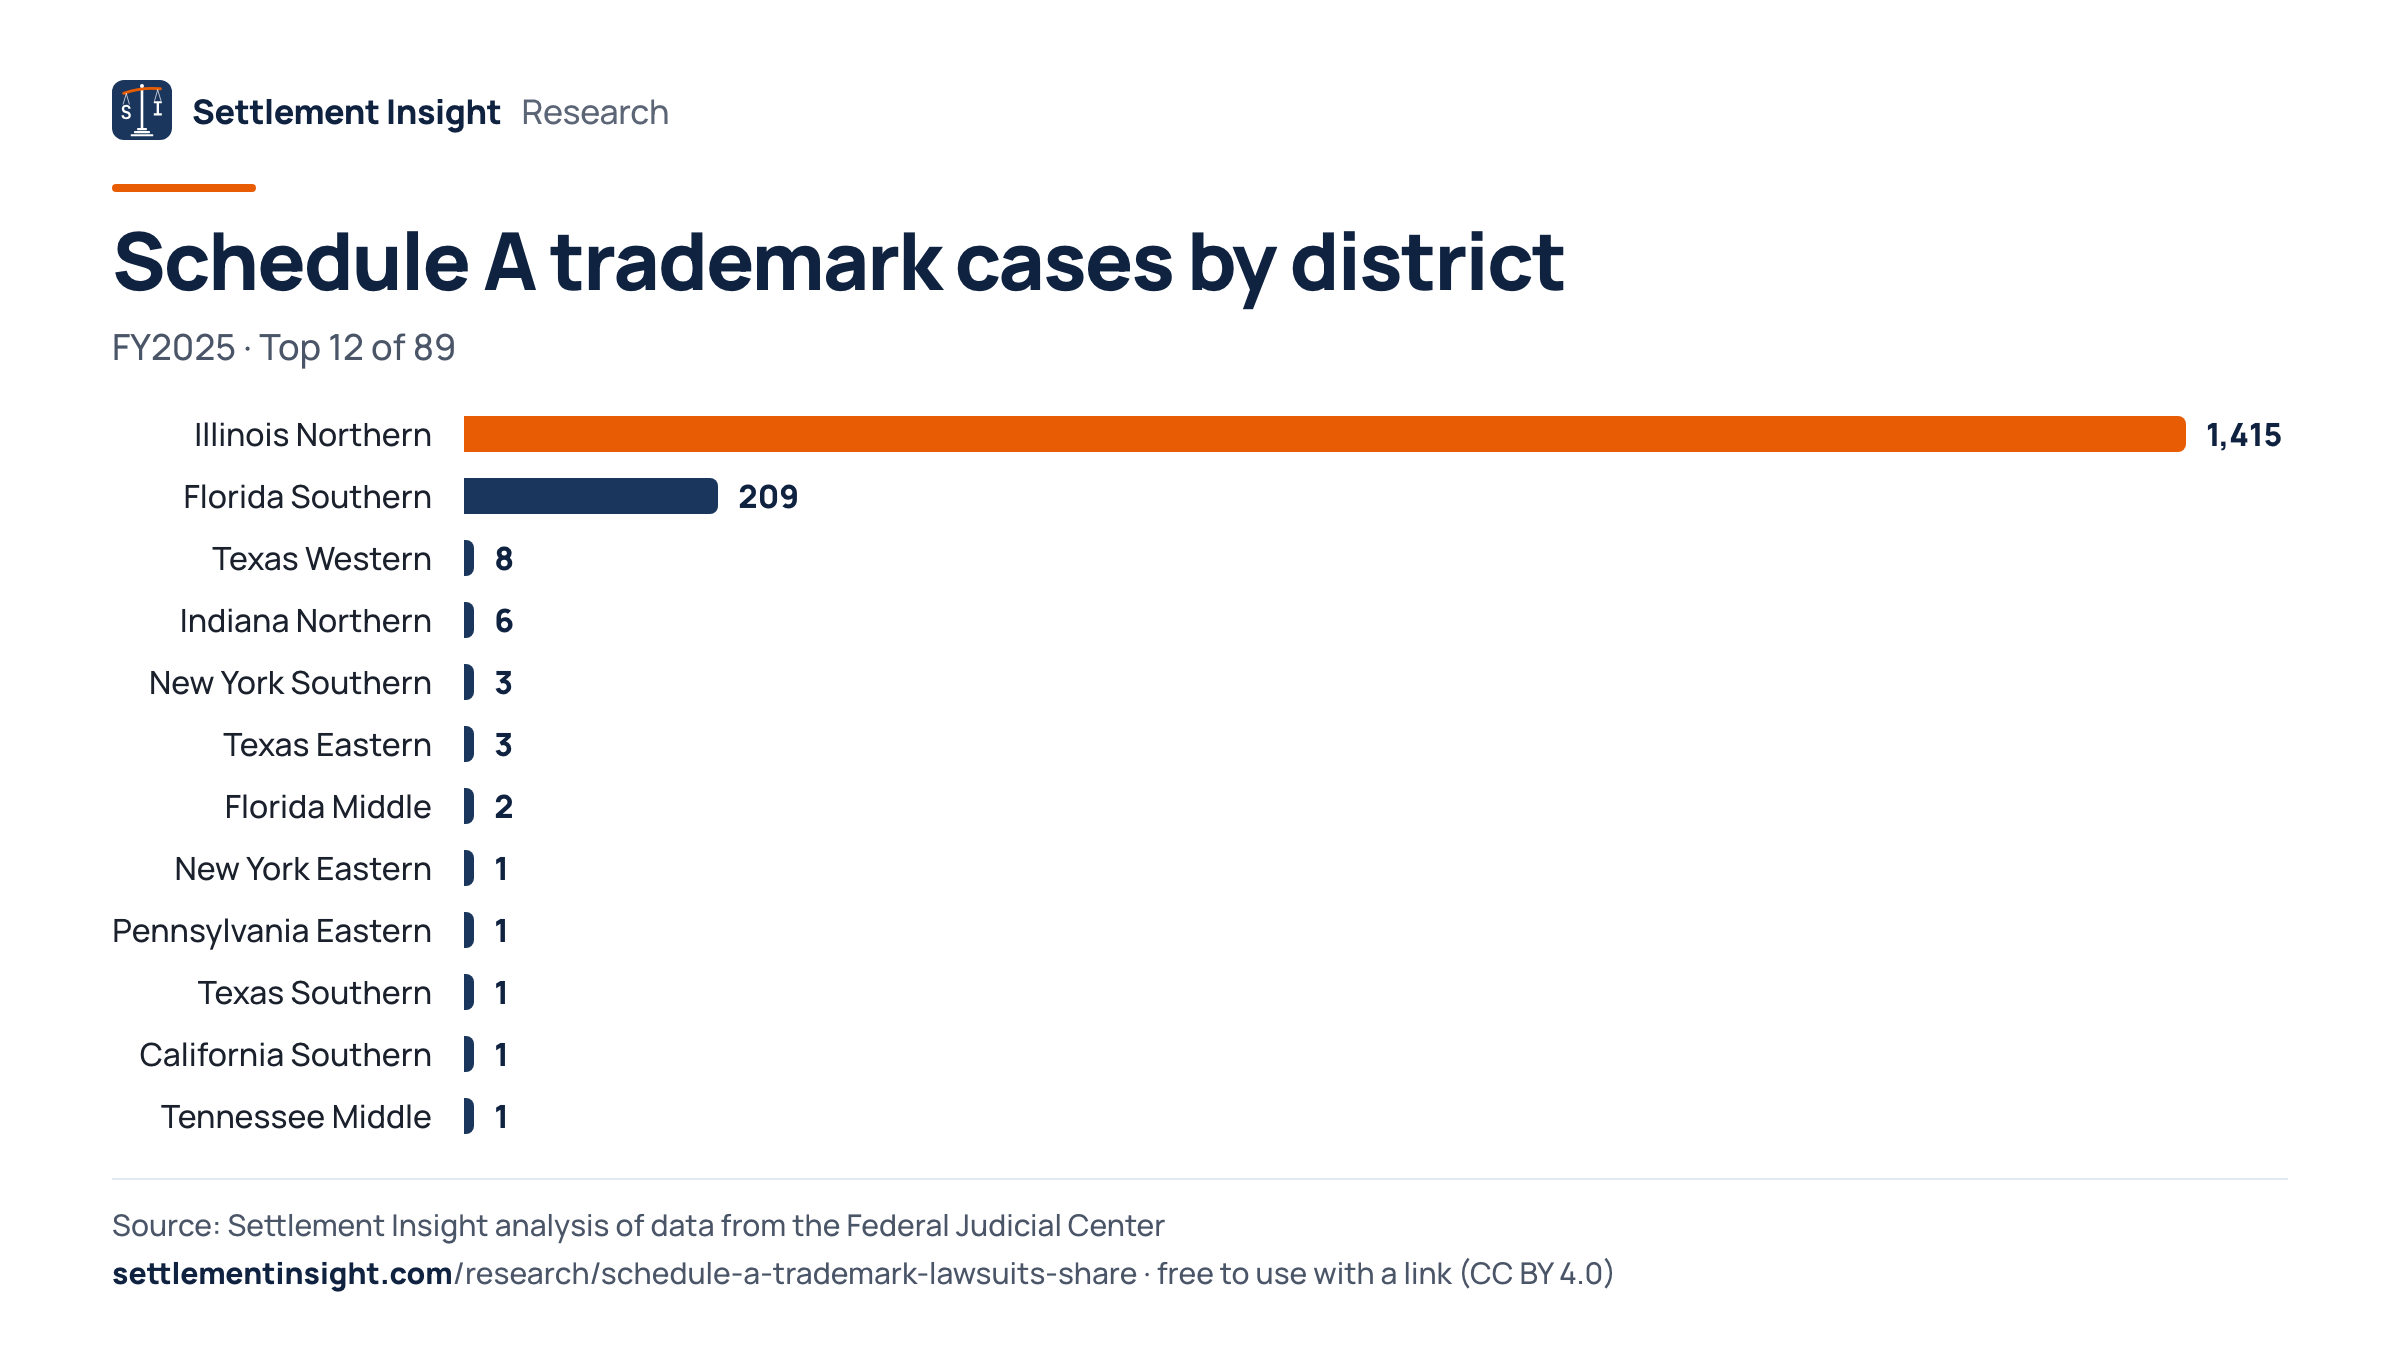
The Northern District of Illinois received 1,415 of the 1,653 Schedule A trademark cases in fiscal 2025 (85.6%). Schedule A cases made up 91.4% of that court's new trademark cases.
Mostly closed by default judgment
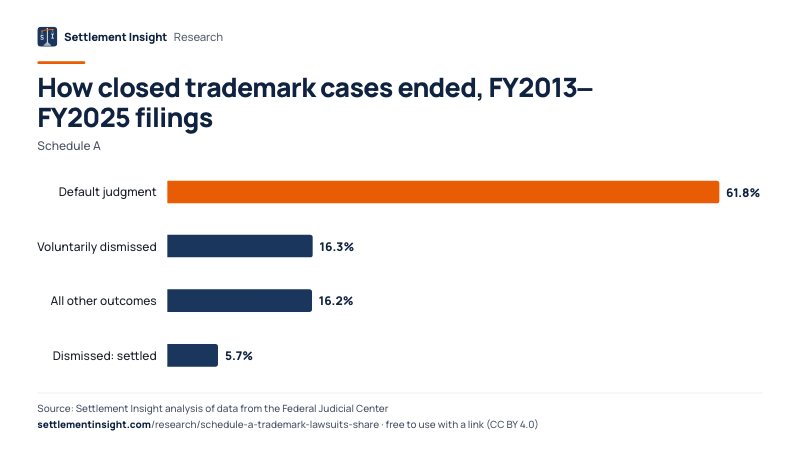
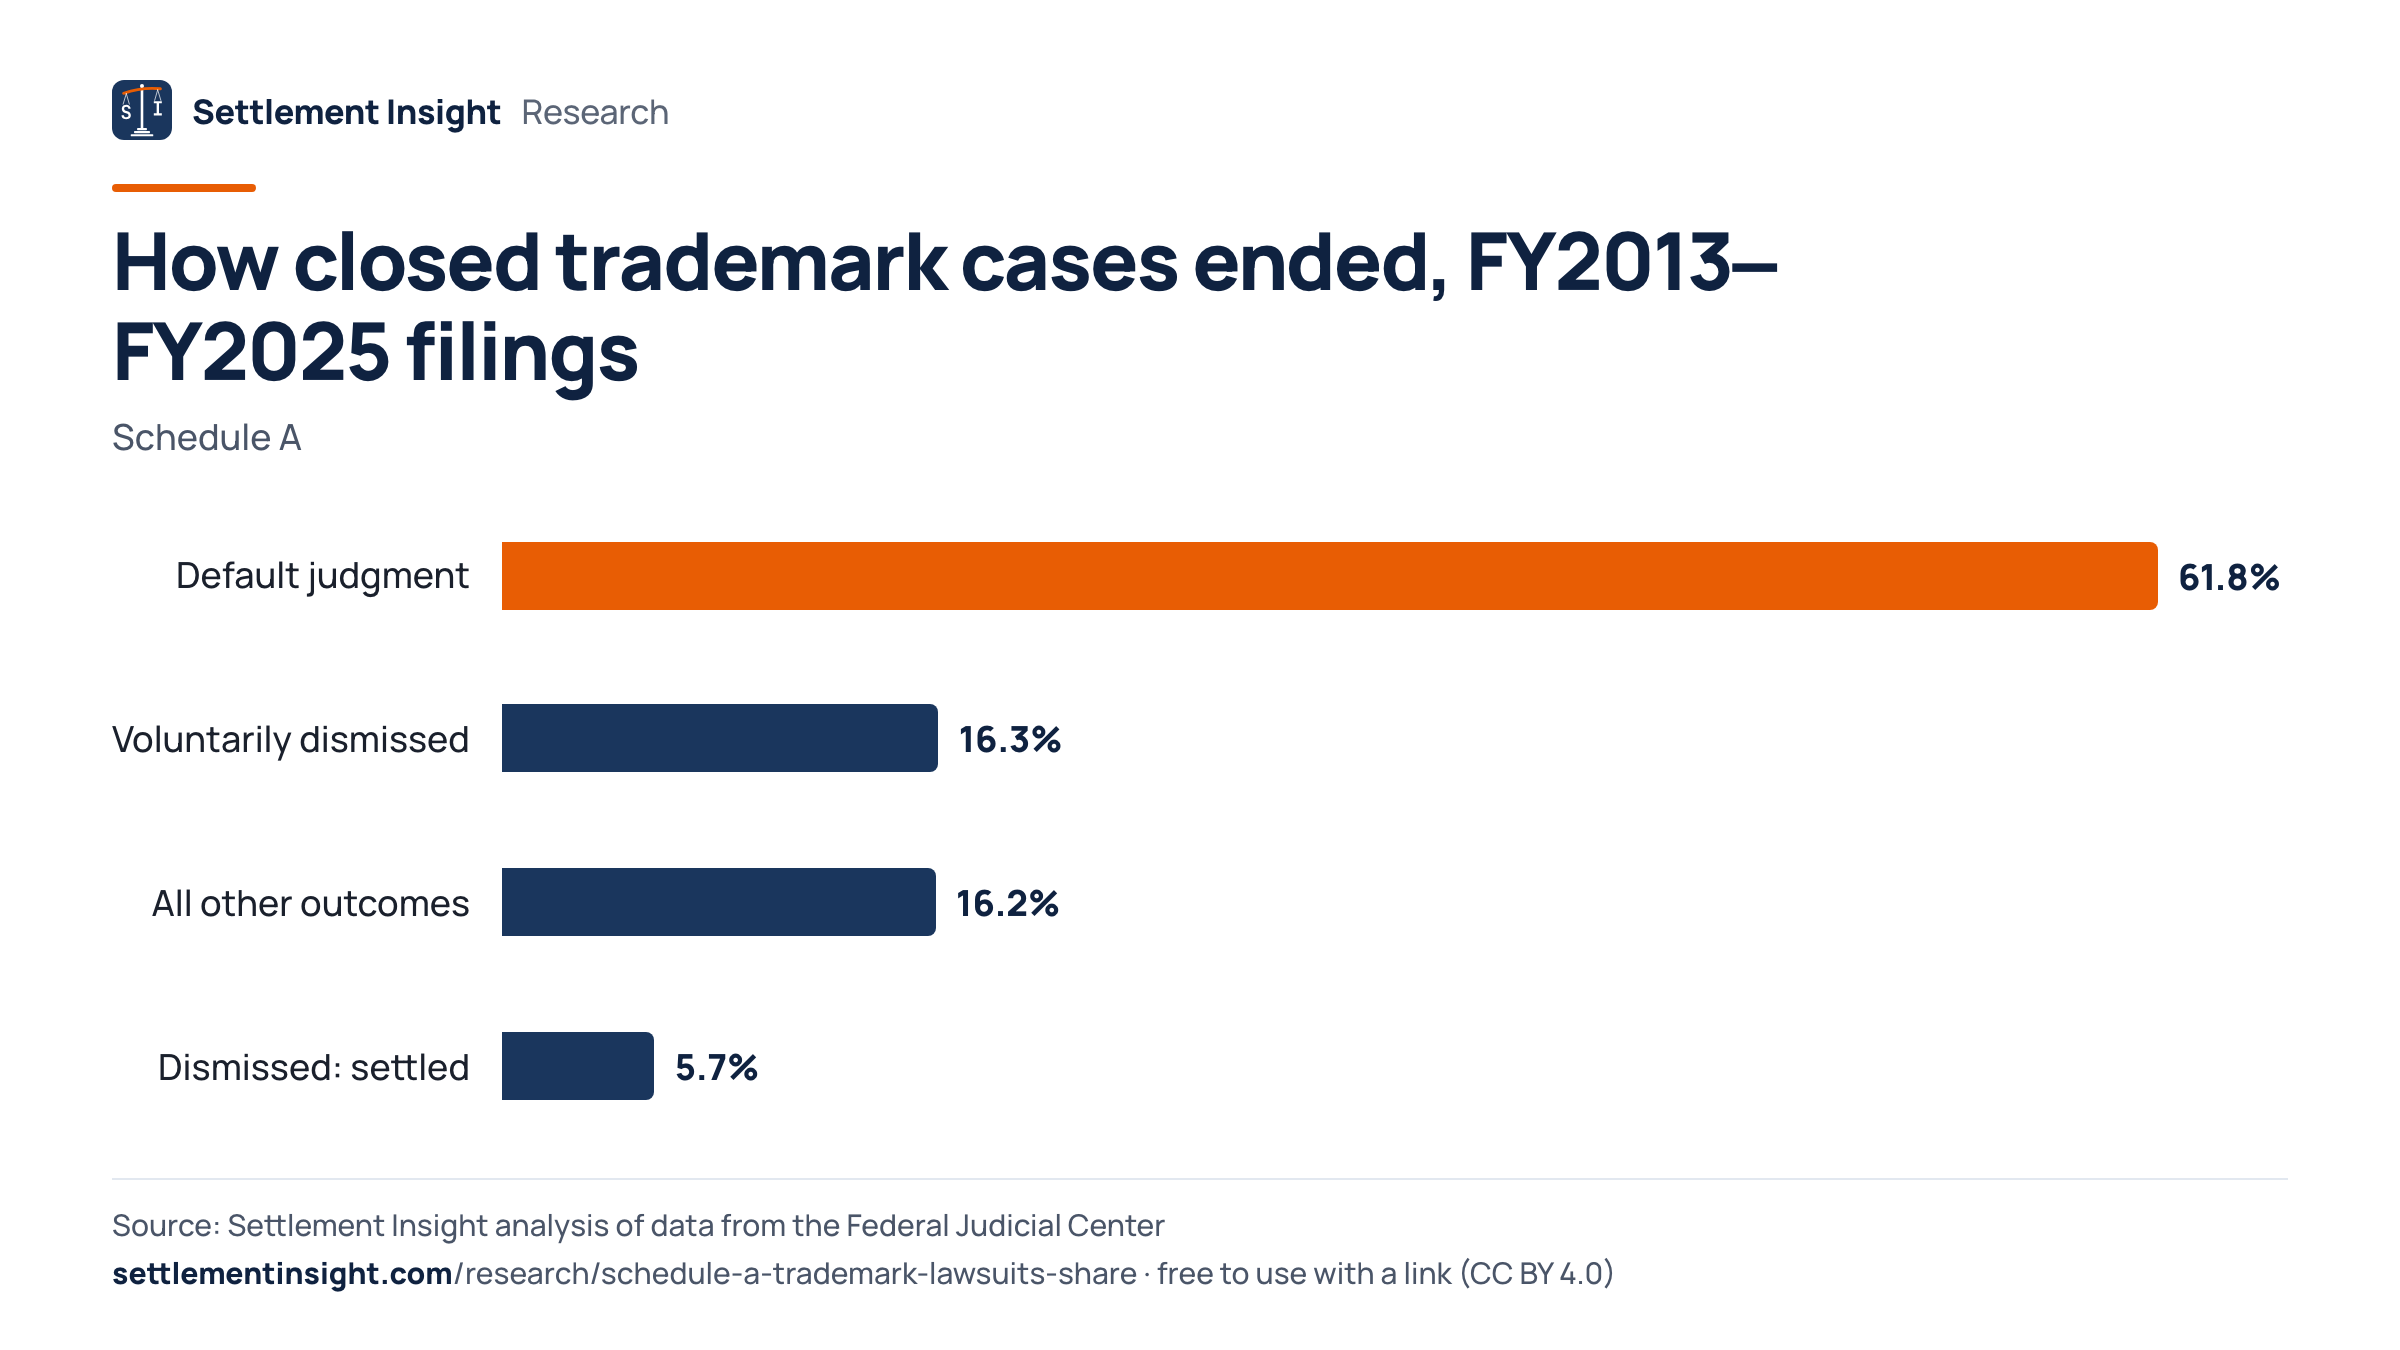
Of the terminated Schedule A trademark cases filed since fiscal 2013, 61.8% ended in a default judgment, compared with 10.0% of other trademark cases.
Not only trademarks
Schedule A captions also appeared in 771 copyright and 309 patent cases filed in fiscal 2025.
What Share of Trademark Lawsuits Are Schedule A Cases
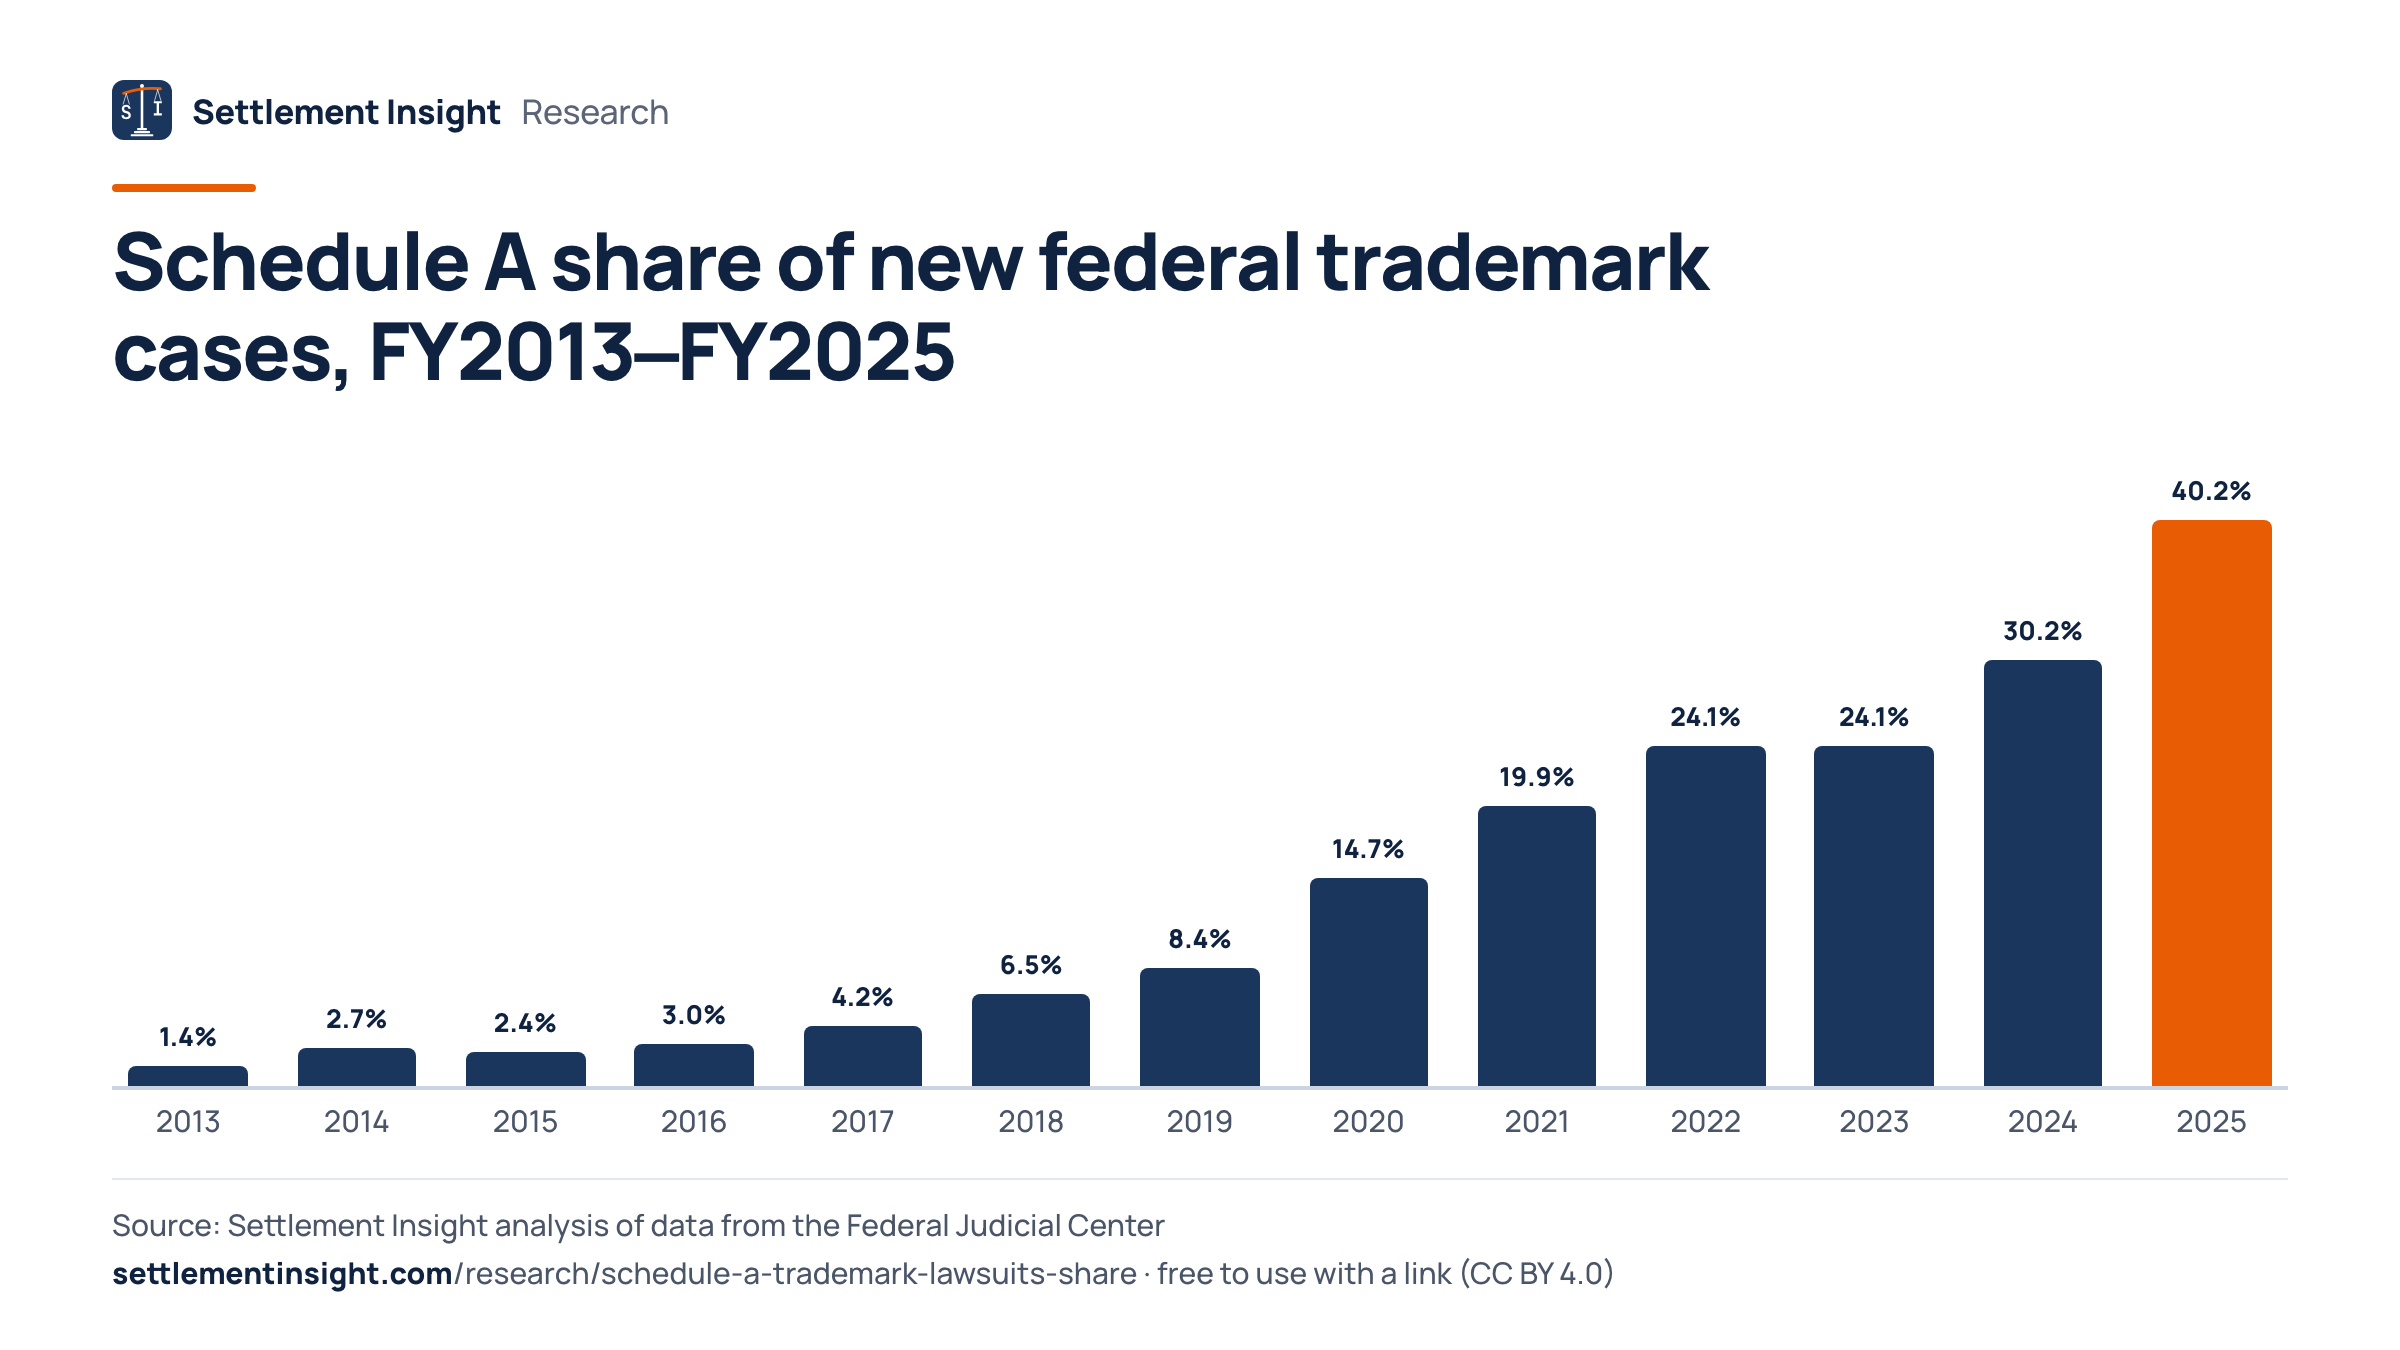
New federal trademark cases (nature-of-suit code 840) per fiscal year, and the share whose first-listed defendant is a Schedule A caption.
40.2% in fiscal 2025, up from 30.2% in fiscal 2024 and 1.4% in fiscal 2013.
In a Schedule A case, the plaintiff lists the defendants on a schedule attached to the complaint instead of naming them in the case caption. The caption then reads, for example, "The Partnerships and Unincorporated Associations Identified on Schedule A." The defendants are typically online storefronts on e-commerce marketplaces.
In fiscal 2013, 43 federal trademark cases carried such a caption, 1.4% of new trademark filings. By fiscal 2025 the count had reached 1,653, or 40.2%. Over the full period from fiscal 2013 through fiscal 2025, we counted 6,151 Schedule A trademark cases.
A single case can name dozens or hundreds of sellers. These figures count cases, not defendants.
Schedule A share of new federal trademark cases, FY2013–FY2025
- 20131.4%43 of 3,079 cases
- 20142.7%97 of 3,610 cases
- 20152.4%75 of 3,068 cases
- 20163.0%91 of 3,011 cases
- 20174.2%122 of 2,888 cases
- 20186.5%195 of 3,008 cases
- 20198.4%287 of 3,415 cases
- 202014.7%406 of 2,760 cases
- 202119.9%622 of 3,128 cases
- 202224.1%716 of 2,971 cases
- 202324.1%859 of 3,568 cases
- 202430.2%985 of 3,257 cases
- 202540.2%1,653 of 4,117 cases
Federal court fiscal years run from October 1 to September 30. FY2025 covers cases filed from October 1, 2024, through September 30, 2025.
How Much of the 2025 Trademark Increase Came From Schedule A Cases
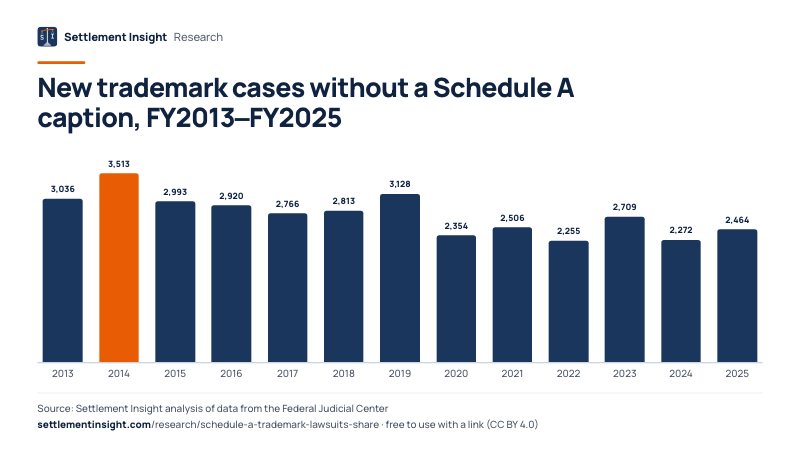
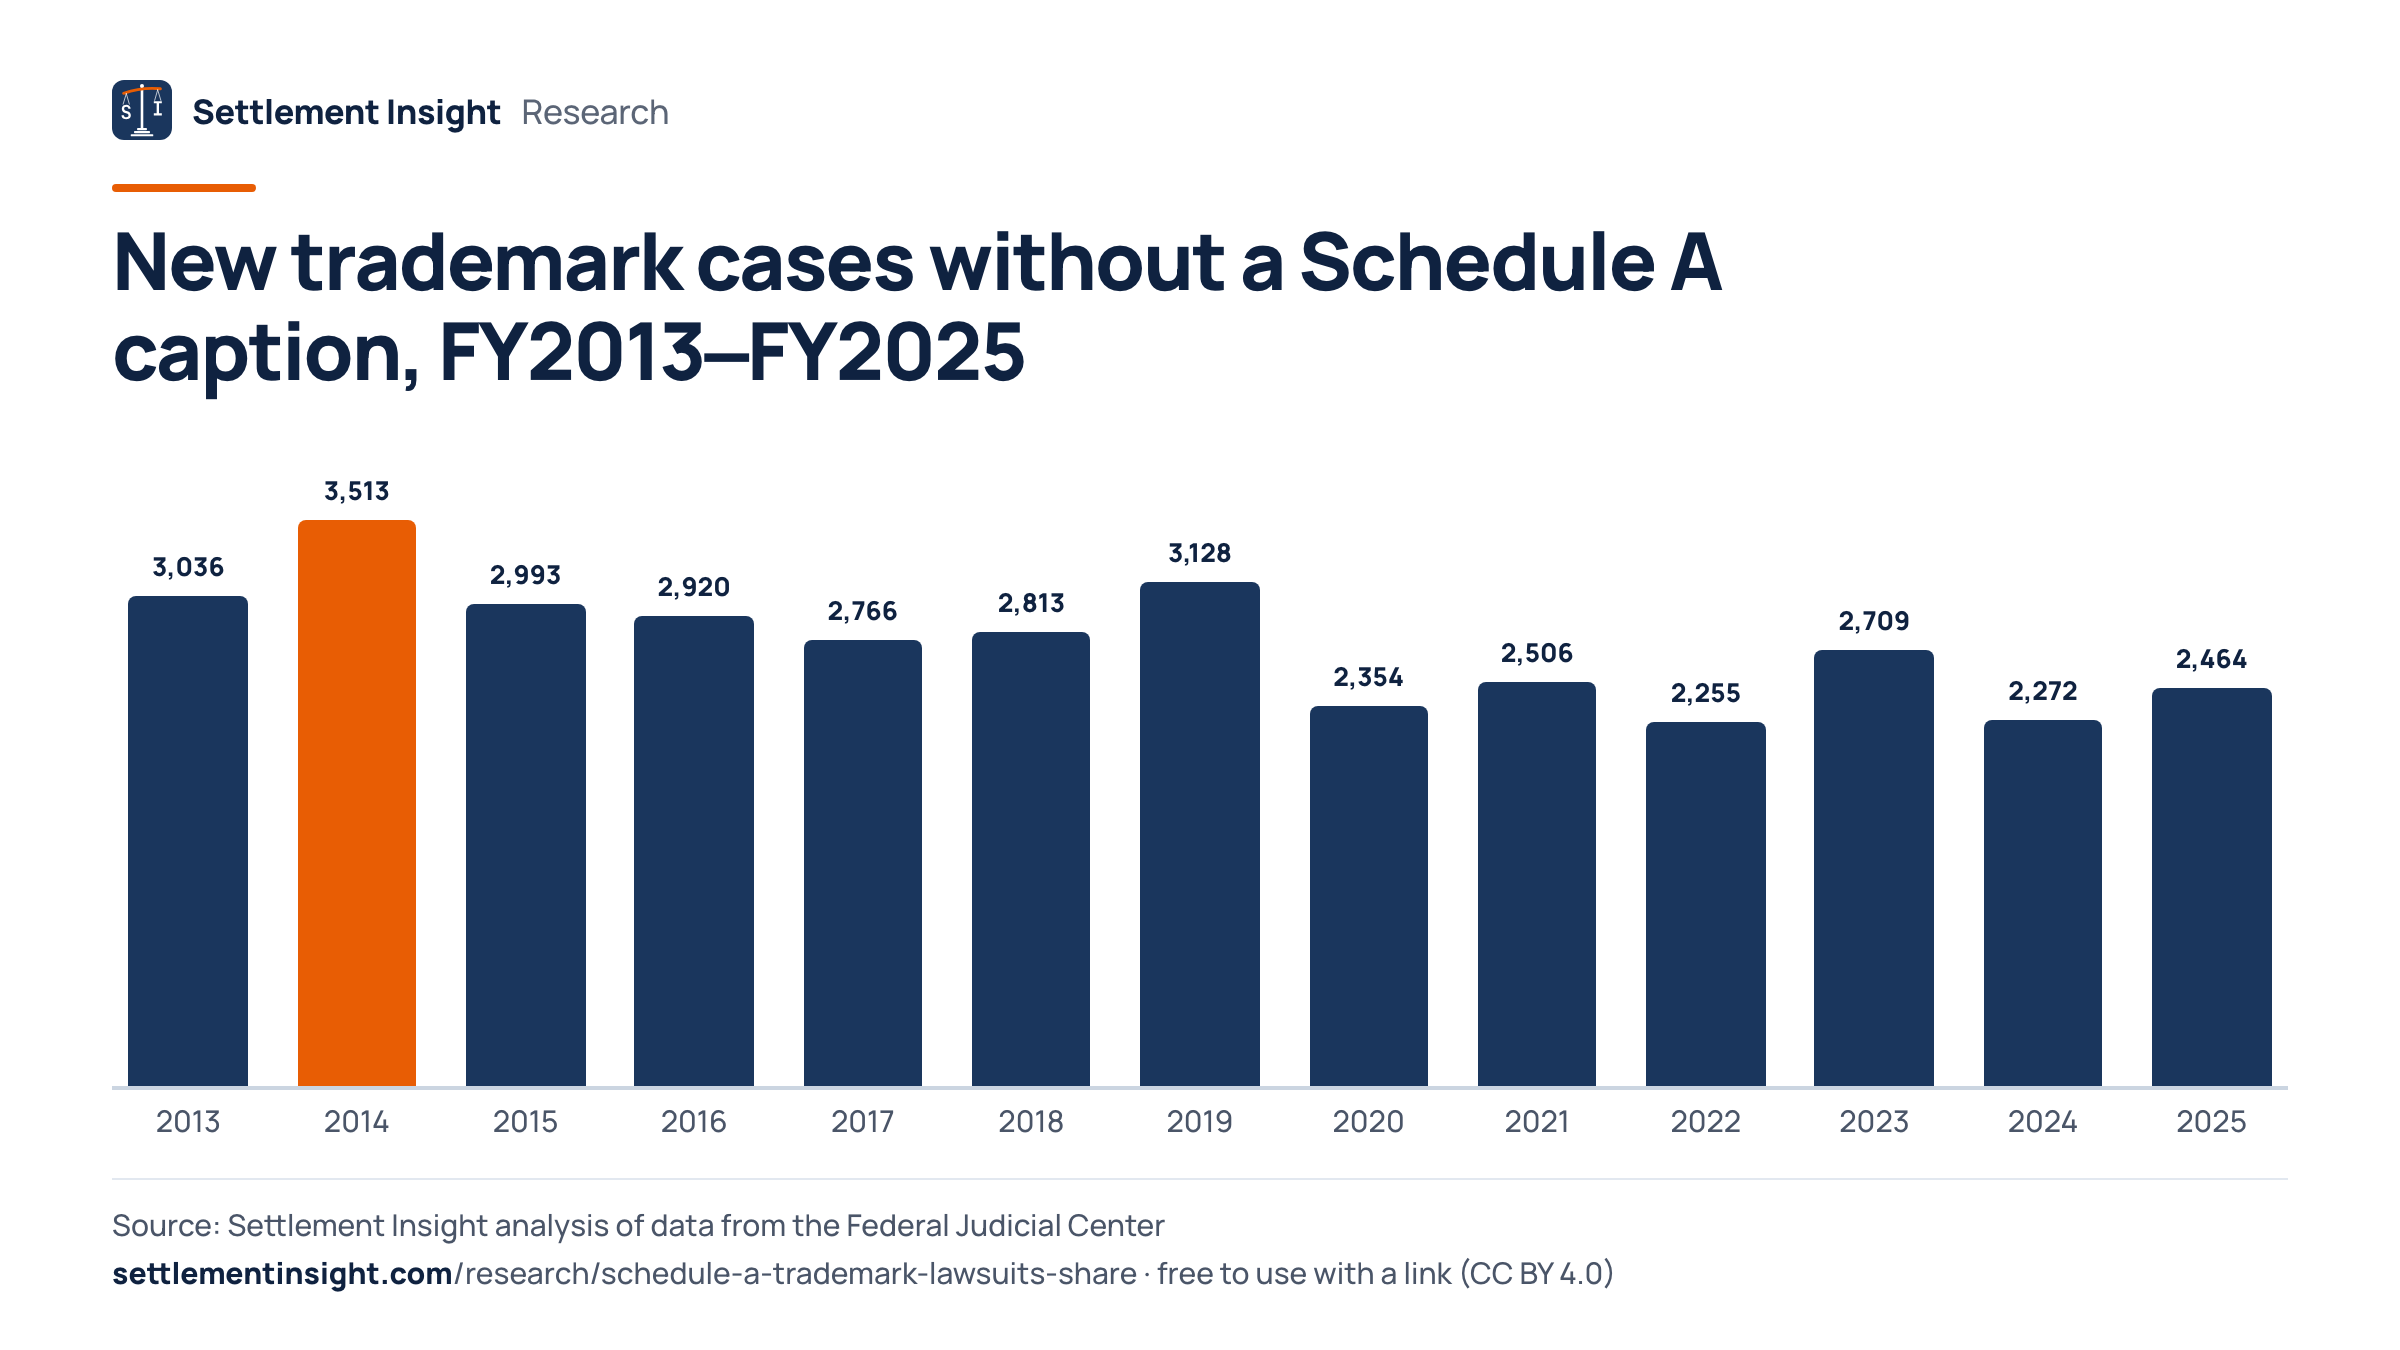
New trademark cases without a Schedule A caption, per fiscal year.
Schedule A cases rose by 668, accounting for 77.7% of the 860-case increase in new trademark filings.
The Administrative Office of the U.S. Courts reported that trademark filings rose by 848 cases in fiscal 2025. In our count, new trademark cases rose by 860, and Schedule A cases by 668, a factor of 1.7× over fiscal 2024.
Trademark cases without a Schedule A caption numbered 2,464 in fiscal 2025, compared with 2,272 in fiscal 2024. Their number was lower in fiscal 2025 than in fiscal 2013, while the Schedule A count grew in nearly every year.
New trademark cases without a Schedule A caption, FY2013–FY2025
- 20133,03643 Schedule A cases
- 20143,51397 Schedule A cases
- 20152,99375 Schedule A cases
- 20162,92091 Schedule A cases
- 20172,766122 Schedule A cases
- 20182,813195 Schedule A cases
- 20193,128287 Schedule A cases
- 20202,354406 Schedule A cases
- 20212,506622 Schedule A cases
- 20222,255716 Schedule A cases
- 20232,709859 Schedule A cases
- 20242,272985 Schedule A cases
- 20252,4641,653 Schedule A cases
Where Are Schedule A Cases Filed
Schedule A trademark cases by federal district court, fiscal 2025 and fiscal 2013–2025 combined.
The Northern District of Illinois received 85.6% of Schedule A trademark cases in fiscal 2025 and 85.5% since fiscal 2013.
The Northern District of Illinois, based in Chicago, received 1,415 Schedule A trademark cases in fiscal 2025. That court reported 1,555 trademark filings in total, including reopened cases. Of its 1,548 new trademark cases, Schedule A cases made up 91.4%.
Outside Chicago, 238 Schedule A trademark cases were filed in fiscal 2025, most of them in the Southern District of Florida. In total, 14 federal districts received at least one such case that year. The table ranks districts by case counts; it does not adjust for the size of each court's docket.
Schedule A trademark cases by district
| District | FY2025 | Share | Since 2013 |
|---|---|---|---|
| Illinois Northern | 1,415 | 91% | 5,260 |
| Florida Southern | 209 | 55% | 733 |
| Virginia Eastern | 0 | 0% | 51 |
| Florida Middle | 2 | 3% | 33 |
| New York Southern | 3 | 1% | 27 |
| Texas Western | 8 | 15% | 12 |
| Indiana Northern | 6 | 55% | 6 |
| New York Eastern | 1 | 1% | 4 |
| Pennsylvania Eastern | 1 | 2% | 4 |
| Texas Eastern | 3 | 10% | 3 |
All districts
| District | FY2025 | Share | Since 2013 |
|---|---|---|---|
| Hawaii | 0 | 0% | 3 |
| California Central | 0 | 0% | 2 |
| Texas Southern | 1 | 2% | 2 |
| North Carolina Western | 0 | 0% | 2 |
| California Northern | 0 | 0% | 1 |
| Washington Western | 0 | 0% | 1 |
| California Southern | 1 | 3% | 1 |
| Tennessee Middle | 1 | 5% | 1 |
| Minnesota | 0 | 0% | 1 |
| Pennsylvania Western | 1 | 6% | 1 |
| Tennessee Western | 0 | 0% | 1 |
| Rhode Island | 1 | 33% | 1 |
| Illinois Southern | 0 | 0% | 1 |
| Georgia Northern | 0 | 0% | 0 |
| New Jersey | 0 | 0% | 0 |
| Texas Northern | 0 | 0% | 0 |
| Arizona | 0 | 0% | 0 |
| Utah | 0 | 0% | 0 |
| Colorado | 0 | 0% | 0 |
| Michigan Eastern | 0 | 0% | 0 |
| Nevada | 0 | 0% | 0 |
| South Carolina | 0 | 0% | 0 |
| Delaware | 0 | 0% | 0 |
| Ohio Northern | 0 | 0% | 0 |
| Massachusetts | 0 | 0% | 0 |
| Maryland | 0 | 0% | 0 |
| Ohio Southern | 0 | 0% | 0 |
| Connecticut | 0 | 0% | 0 |
| California Eastern | 0 | 0% | 0 |
| Michigan Western | 0 | 0% | 0 |
| Missouri Eastern | 0 | 0% | 0 |
| Indiana Southern | 0 | 0% | 0 |
| Kentucky Western | 0 | 0% | 0 |
| Oregon | 0 | 0% | 0 |
| Missouri Western | 0 | 0% | 0 |
| Wisconsin Western | 0 | 0% | 0 |
| Louisiana Eastern | 0 | 0% | 0 |
| New York Northern | 0 | 0% | 0 |
| North Carolina Eastern | 0 | 0% | 0 |
| Pennsylvania Middle | 0 | 0% | 0 |
| Kansas | 0 | 0% | 0 |
| Kentucky Eastern | 0 | 0% | 0 |
| Louisiana Middle | 0 | 0% | 0 |
| New York Western | 0 | 0% | 0 |
| Wisconsin Eastern | 0 | 0% | 0 |
| Louisiana Western | 0 | 0% | 0 |
| Nebraska | 0 | 0% | 0 |
| North Carolina Middle | 0 | 0% | 0 |
| Oklahoma Western | 0 | 0% | 0 |
| Florida Northern | 0 | 0% | 0 |
| Tennessee Eastern | 0 | 0% | 0 |
| Virginia Western | 0 | 0% | 0 |
| Idaho | 0 | 0% | 0 |
| Iowa Southern | 0 | 0% | 0 |
| New Hampshire | 0 | 0% | 0 |
| Washington Eastern | 0 | 0% | 0 |
| Alabama Northern | 0 | 0% | 0 |
| Alabama Southern | 0 | 0% | 0 |
| Arkansas Eastern | 0 | 0% | 0 |
| District of Columbia | 0 | 0% | 0 |
| Georgia Southern | 0 | 0% | 0 |
| Mississippi Southern | 0 | 0% | 0 |
| Montana | 0 | 0% | 0 |
| Oklahoma Northern | 0 | 0% | 0 |
| Georgia Middle | 0 | 0% | 0 |
| Illinois Central | 0 | 0% | 0 |
| Maine | 0 | 0% | 0 |
| New Mexico | 0 | 0% | 0 |
| North Dakota | 0 | 0% | 0 |
| Puerto Rico | 0 | 0% | 0 |
| Vermont | 0 | 0% | 0 |
| West Virginia Northern | 0 | 0% | 0 |
| Wyoming | 0 | 0% | 0 |
| Alaska | 0 | 0% | 0 |
| Arkansas Western | 0 | 0% | 0 |
| Iowa Northern | 0 | 0% | 0 |
| South Dakota | 0 | 0% | 0 |
| Virgin Islands | 0 | 0% | 0 |
| West Virginia Southern | 0 | 0% | 0 |
District names follow the Federal Judicial Center's labels: "Illinois Northern" is the Northern District of Illinois. Share = Schedule A cases as a share of the district's new trademark cases in FY2025.
How Do Schedule A Cases End
Disposition of trademark cases filed in fiscal 2013–2025 and closed by June 30, 2026.
Default judgments closed 61.8% of Schedule A cases, against 10.0% of other trademark cases.
Courts report one disposition code for each closed case. Among 6,099 closed Schedule A trademark cases, 61.8% ended in a default judgment, 16.3% in a voluntary dismissal and 5.7% were coded as settled. Among 34,445 other closed trademark cases, the figures were 10.0%, 30.5% and 27.7%.
The median Schedule A case closed 97 days after filing, compared with 197 days for other trademark cases. Because one case can involve many defendants, a single disposition code does not show how each individual seller's claims were resolved.
How closed trademark cases ended, FY2013–FY2025 filings
| Outcome | Schedule A | Other cases |
|---|---|---|
| Default judgment | 61.8% | 10.0% |
| Voluntarily dismissed | 16.3% | 30.5% |
| All other outcomes | 16.2% | 31.8% |
| Dismissed: settled | 5.7% | 27.7% |
Download the Data and Cite This Study
Every table as a CSV file and in one Excel workbook, a short PDF summary and every chart as an image, free to reuse with attribution (CC BY 4.0).
- Outcomes of terminated Schedule A and other trademark casesDisposition of trademark cases filed FY2013–FY2025 and terminated by June 30, 2026, Schedule A cases versus all other new trademark cases. · 4 rows · CSV, 1 KB
- Schedule A trademark cases by federal districtSchedule A-captioned and all new trademark cases per federal district for FY2025, plus cumulative Schedule A cases FY2013–FY2025. · 89 rows · CSV, 3 KB
- Schedule A share of federal trademark cases by fiscal yearNew trademark cases (nature of suit 840) and Schedule A-captioned cases per federal fiscal year, FY2013–FY2025, with the Northern District of Illinois share. · 13 rows · CSV, 1 KB
- All tables in one Excel workbookOne sheet per table plus an About sheet with sources, method and citation · Excel (.xlsx), 15 KB
- Summary to print or forward (3 pages)Short answer, key figures, main chart, findings, method and citation · PDF, 192 KB
Charts for your story
Schedule A share of new federal trademark cases, FY2013–FY2025
Embed this chart
New trademark cases without a Schedule A caption, FY2013–FY2025
Embed this chart
Schedule A trademark cases by district
Embed this chart
How closed trademark cases ended, FY2013–FY2025 filings
Embed this chart
How to cite
Goldberg, L. (2026). Schedule A Trademark Lawsuits — Share of Federal Trademark Cases by Fiscal Year and District (FY2013–FY2025) [Data set]. Settlement Insight. https://settlementinsight.com/research/schedule-a-trademark-lawsuits-share
BibTeX
@dataset{goldberg_2026_schedule_a_trademark_lawsuits_share,
  author    = {Goldberg, Leonard},
  title     = {Schedule A Trademark Lawsuits --- Share of Federal Trademark Cases by Fiscal Year and District (FY2013--FY2025)},
  year      = {2026},
  publisher = {Settlement Insight},
  url       = {https://settlementinsight.com/research/schedule-a-trademark-lawsuits-share}
}How We Measured
Checked against published figures
- Trademark cases filed in U.S. district courts, fiscal year 2025 (all filings incl. reopened cases): published 4,211, our count 4,217 (0.14% apart).U.S. District Courts — Judicial Business 2025
- Trademark cases filed in the Northern District of Illinois, fiscal year 2025: published 1,555, our count 1,555 (exact match).U.S. District Courts — Judicial Business 2025
- Increase in trademark cases filed, fiscal year 2025 over fiscal year 2024: published 848, our count 853 (0.59% apart).U.S. District Courts — Judicial Business 2025
Full method and limits of the data
Calibration: counting all filings, including reopened cases, we found 4,217 trademark cases in fiscal 2025; the Administrative Office of the U.S. Courts reported 4,211. For the Northern District of Illinois we found 1,555, the same as the published 1,555.
New cases: for the share, we first excluded reopened cases (origin codes 4 and 8–12 in the FJC codebook; 99 rows in fiscal 2025). Among the remaining rows we then treated rows with the same district, docket number and filing date as one case, regardless of the office code (the same case often appears in two annual releases or with a changed office code), and kept the row with the latest release year (tapeyear; 2099 marks pending cases). Rows from other natures of suit play no part in this step. That removed 49 rows over the study period, 1 of them in fiscal 2025, and leaves 4,117 new trademark cases in fiscal 2025.
Classification: the IDB records the first-listed defendant, cut to 30 characters. We converted that field to upper case, trimmed surrounding spaces, dropped one optional leading "THE " or "UNKNOWN " and counted a case as a Schedule A case when the rest begins with one of these strings; truncated words count, other spellings do not: "PARTNERSHIP" or "PARTNERSHIPS" as a whole word, or the misspelling "PARTNETSHIPS"; "UNINCORPORATED"; "SCHEDULE A"; "INDIVIDUAL", "INDIVIDUALS" or "INDIVIDUAL(S)", then an optional comma, one or more spaces, an optional "AND" or "OR" with one or more spaces, and a word beginning with BU, CO, EN, LI, PA or UN (so "THE INDIVIDUALS, CORPO", "THE INDIVIDUALS AND ENT", "THE INDIVIDUALS AND BUS" and "UNKNOWN INDIVIDUAL(S), PARTNER" count); "ENTITIES" followed directly by a comma, whatever comes after it (so "THE ENTITIES, PARTNERSH" counts), or "ENTITIES" followed by a space and "AND", "IDENTIF" or "LISTED"; "BUSINESS ENTITIES"; "CORPORATIONS, " (as in "THE CORPORATIONS, PARTNERSHIPS"); or "DEFENDANTS" or "PARTIES" followed by a space and "IDENTIF" or "LISTED" (so the truncated "THE DEFENDANTS IDENTIFI" counts). Every other caption does not count, among them captions beginning with "DOES" or "JOHN DOE" (even when followed by "as identified in Exhibit"), "DEF", "AN INDIVIDUAL", "UNKNOWN PARTIES", "UNKNOWN PARTY", "UNIDENTIFIED", "ENTITY AND/OR INDIVIDUAL" or "DOMAINS IDENTIFIED", and captions such as "[REDACTED] AND THE INDIVIDUALS" that do not start with the collective wording. We reviewed every distinct caption string that matched.
Outcomes: a case counts as closed when it has a termination date on or before June 30, 2026. Default judgment = disposition code 4, voluntary dismissal = code 12, settled = code 13.
What this data cannot tell you
- The count is a lower bound. Cases filed under a placeholder caption ("ABC v. DEF" in the Southern District of New York), under seal, or against "Does" are not counted; 109 new trademark cases in fiscal 2025 had such a caption.
- The data count cases, not defendants. A single Schedule A case may name hundreds of online sellers, so the number of sellers sued is far larger than the case count but cannot be measured from the IDB.
- The classification depends on the caption, not on the complaint. Cases that sue many anonymous sellers but name the first defendant individually are not counted, and the data cannot show whether the claims in any case had merit.
- Outcome figures reflect the IDB release through June 30, 2026. 52 Schedule A cases from the study period were still pending, and courts can report dispositions late, so the shares for the most recent filings may change.
- Rankings by district use raw case counts and do not adjust for the size of each court's caseload.
Frequently Asked Questions
What is a Schedule A lawsuit?
It is a federal lawsuit, usually over trademarks, copyrights or patents, in which the defendants are listed on a schedule attached to the complaint rather than named in the caption. The defendants are typically online sellers. In fiscal 2025, 1,653 federal trademark cases used this format.
How many trademark lawsuits are Schedule A cases?
In fiscal 2025, 40.2% of new federal trademark cases were Schedule A cases: 1,653 of 4,117. In fiscal 2013 the share was 1.4%.
Why are so many Schedule A cases filed in Illinois?
The Northern District of Illinois received 85.6% of Schedule A trademark cases in fiscal 2025 and 85.5% since fiscal 2013. Court records show where cases are filed, not why plaintiffs choose a court.
How do Schedule A cases usually end?
Of closed Schedule A trademark cases filed since fiscal 2013, 61.8% ended in a default judgment and 16.3% in a voluntary dismissal. A case-level code does not show how claims against each individual seller were resolved.
How long does a Schedule A case take?
The median closed Schedule A trademark case ended 97 days after filing, compared with 197 days for other trademark cases.
Are Schedule A cases only about trademarks?
No. In fiscal 2025, Schedule A captions also appeared in 771 copyright cases and 309 patent cases. Trademark cases made up 60.5% of the 2,733 Schedule A cases in these three categories.
Sources
- Integrated Database (IDB): Civil cases filed, terminated, and pending from SY 1988 to present — Federal Judicial Center
- Civil Codebook 1988 Forward — Federal Judicial Center
- U.S. District Courts — Judicial Business 2025 — Administrative Office of the U.S. Courts
- SAD scheme — Wikipedia
 Independent analysis. Settlement Insight is not a law firm and not affiliated with any agency named here. Analysis by Leonard Goldberg, Editor. How we work: methodology, our data.
More Research and Data
Other studies from our database of public legal records — each with free CSV downloads.
Related research
Latest studies
- Clayton lenders in mobile home complaintsTwo Clayton Homes lenders account for 44.3% of CFPB manufactured home loan complaints
- Credit Card Interest ComplaintsSynchrony: 736 CFPB complaints about credit card interest in 2025, the most of any company
- Earned Wage Access ComplaintsDave leads: 65 of 1,177 CFPB earned wage access and advance complaints
- Gift Card Complaints by CompanyAmerican Express: 50.6% of CFPB gift card complaints in 2024–2025, the most of any company