Which Injuries Do Insurers Dispute Most in New York Workers' Comp Claims
Original analysis of 800,927 records from the New York State Workers' Compensation Board, 2022–2024. Published October 15, 2026.
We counted the 800,927 New York workers' compensation claims assembled from 2022 to 2024 and measured, for each type and cause of injury, how many the insurer or self-insured employer controverted.
What the New York Claim Data Show
Insurers and self-insured employers controverted 46.8% of the 2,920 New York workers' compensation claims for hearing loss assembled from 2022 to 2024, against 3.9% of the 170,812 claims for contusions. The two hearing-loss codes, carpal tunnel syndrome and mental stress lead the 34 ranked injury types; across all 800,927 assembled claims, 6.6% were controverted. A controverted claim is disputed, not necessarily denied: the Board decides it.
- 47%Hearing-loss claims assembled 2022–2024 that were disputed
- 4%Contusion claims assembled 2022–2024 that were disputed
- 52.7KControverted claims assembled, 2022–2024
Hearing loss tops the ranking
Claims coded "loss of hearing" were controverted in 57.4% of cases and claims coded "hearing loss or impairment" in 43.2%. Together, the 2,920 hearing-loss claims were disputed at 11.9× the rate of contusion claims.
Carpal tunnel and mental stress follow
Carpal tunnel syndrome claims were controverted in 39.5% of cases and mental stress claims in 23.7%, against 6.6% for all assembled claims.
Cuts and bruises are rarely disputed
Contusion claims were controverted in 3.9% of cases, lacerations in 1.4% and punctures in 0.8%.
Strains make up the largest number of disputes
Because they are so common, strains or tears account for 15,384 controverted claims, 29.2% of all disputes, although only 7.0% of strain claims were controverted.
Noise, repetition and vehicle crashes by cause
By cause of injury, claims attributed to continual noise were controverted in 48.4% of cases, repetitive-motion strains in 23.3% and collisions with another vehicle in 21.2%.
Counts match the Board's annual report
Our count of controverted claims assembled in 2024, 17,166, is within 0.02% of the 17,162 the Board published in its 2025 Annual Report.
Which Workers' Comp Injuries Are Most Often Disputed in New York
The two hearing-loss codes (loss of hearing; hearing loss or impairment), carpal tunnel syndrome and mental stress are the injury types New York carriers controvert most often, relative to the number of claims, among injury types with at least 500 claims.
Loss of hearing (57.4%), hearing loss or impairment (43.2%) and carpal tunnel syndrome (39.5%) have the highest controverted shares among the 34 ranked injury types.
The ranking uses the nature-of-injury code recorded for each claim in the Board's data, a standard code set of the Workers Compensation Insurance Organizations (WCIO). It covers the 34 injury types with at least 500 claims assembled from 2022 to 2024; catch-all codes such as "all other specific injuries" and claims without a code are counted in the totals but not ranked.
The Board's data use two hearing codes, "loss of hearing" (740 claims, 57.4% controverted) and "hearing loss or impairment" (2,180 claims, 43.2% controverted). Combined, carriers controverted 1,366 of the 2,920 hearing-loss claims, or 46.8%. The share for loss of hearing rose from 54.7% for claims assembled in 2022 to 61.8% for those assembled in 2024; the CSV lists each year for every injury type.
At the other end, carriers controverted 3.9% of contusion claims, 5.9% of fractures and 1.4% of lacerations. The data record that a claim was disputed, not why.
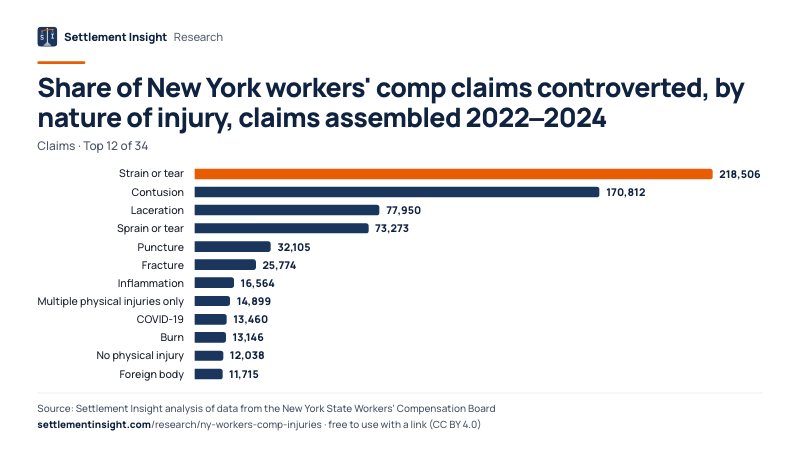
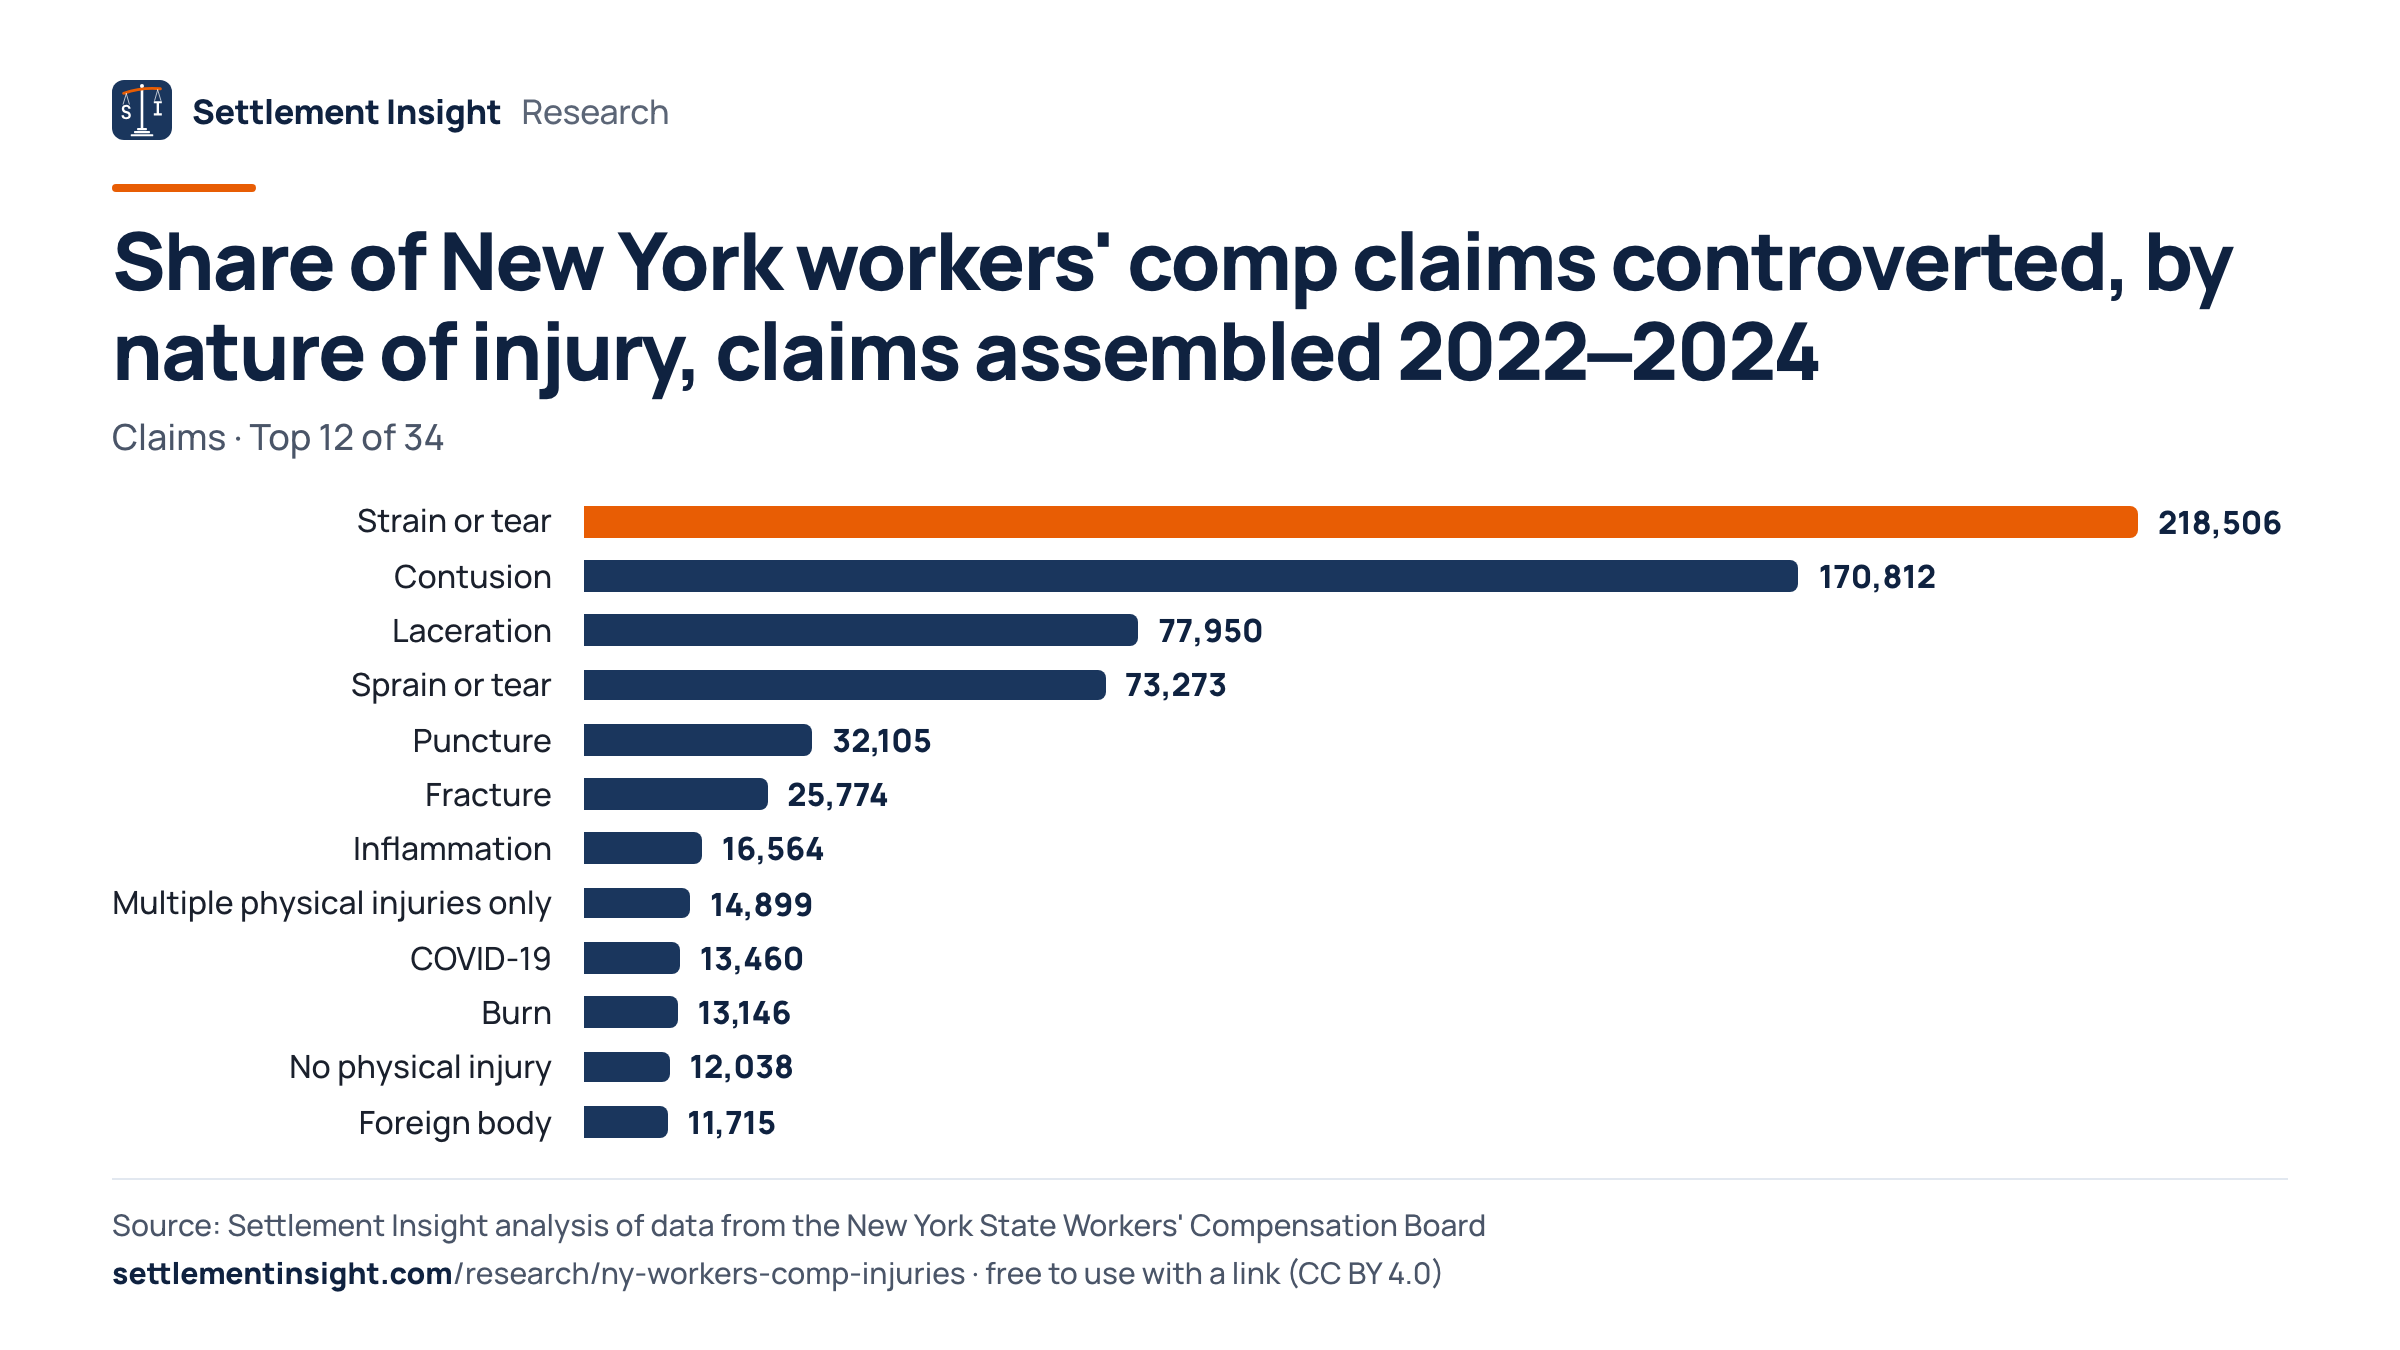
Share of New York workers' comp claims controverted, by nature of injury, claims assembled 2022–2024
| Injury | Claims | Disputed | Share |
|---|---|---|---|
| Loss of hearing | 740 | 425 | 57.4% |
| Hearing loss or impairment | 2,180 | 941 | 43.2% |
| Carpal tunnel syndrome | 2,623 | 1,036 | 39.5% |
| Mental stress | 3,567 | 847 | 23.7% |
| Myocardial infarction | 650 | 149 | 22.9% |
| Mental disorder | 594 | 111 | 18.7% |
| Multiple injuries including both physical and psychological | 563 | 100 | 17.8% |
| Syncope | 3,073 | 404 | 13.1% |
| Multiple physical injuries only | 14,899 | 1,940 | 13.0% |
| Respiratory disorders | 2,247 | 279 | 12.4% |
| Hernia | 2,841 | 333 | 11.7% |
| Sprain or tear | 73,273 | 7,925 | 10.8% |
All 34 injury types
| Injury | Claims | Disputed | Share |
|---|---|---|---|
| No physical injury | 12,038 | 1,200 | 10.0% |
| Dislocation | 6,230 | 612 | 9.8% |
| Heat prostration | 556 | 54 | 9.7% |
| Amputation | 734 | 69 | 9.4% |
| Rupture | 1,180 | 110 | 9.3% |
| Infection | 1,538 | 129 | 8.4% |
| COVID-19 | 13,460 | 1,055 | 7.8% |
| Strain or tear | 218,506 | 15,384 | 7.0% |
| Inflammation | 16,564 | 1,005 | 6.1% |
| Poisoning: chemical, (other than metals) | 645 | 38 | 5.9% |
| Fracture | 25,774 | 1,509 | 5.9% |
| Dermatitis | 1,573 | 73 | 4.6% |
| Concussion | 8,788 | 392 | 4.5% |
| Poisoning: general (not od or cumulative | 703 | 29 | 4.1% |
| Contusion | 170,812 | 6,724 | 3.9% |
| Contagious disease | 1,106 | 43 | 3.9% |
| Electric shock | 1,069 | 40 | 3.7% |
| Crushing | 7,858 | 235 | 3.0% |
| Foreign body | 11,715 | 212 | 1.8% |
| Burn | 13,146 | 206 | 1.6% |
| Laceration | 77,950 | 1,073 | 1.4% |
| Puncture | 32,105 | 244 | 0.8% |
Share = controverted claims divided by all claims of that injury type assembled in the same years. Only injury types with at least 500 claims are shown.
Which Injuries Account for the Most Disputed Claims
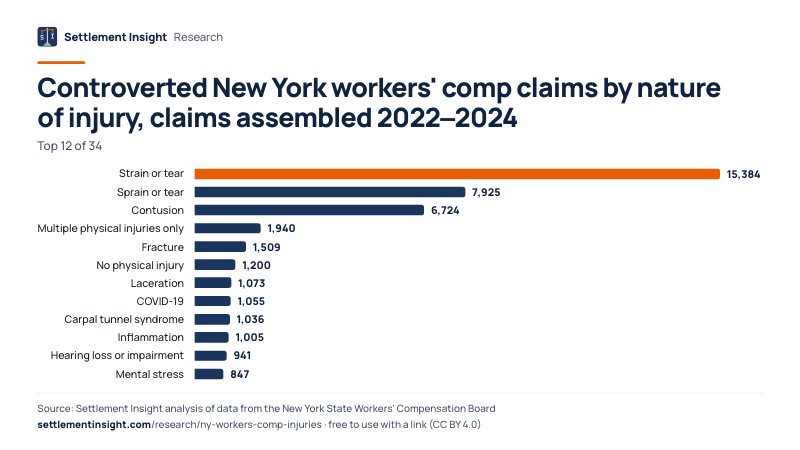
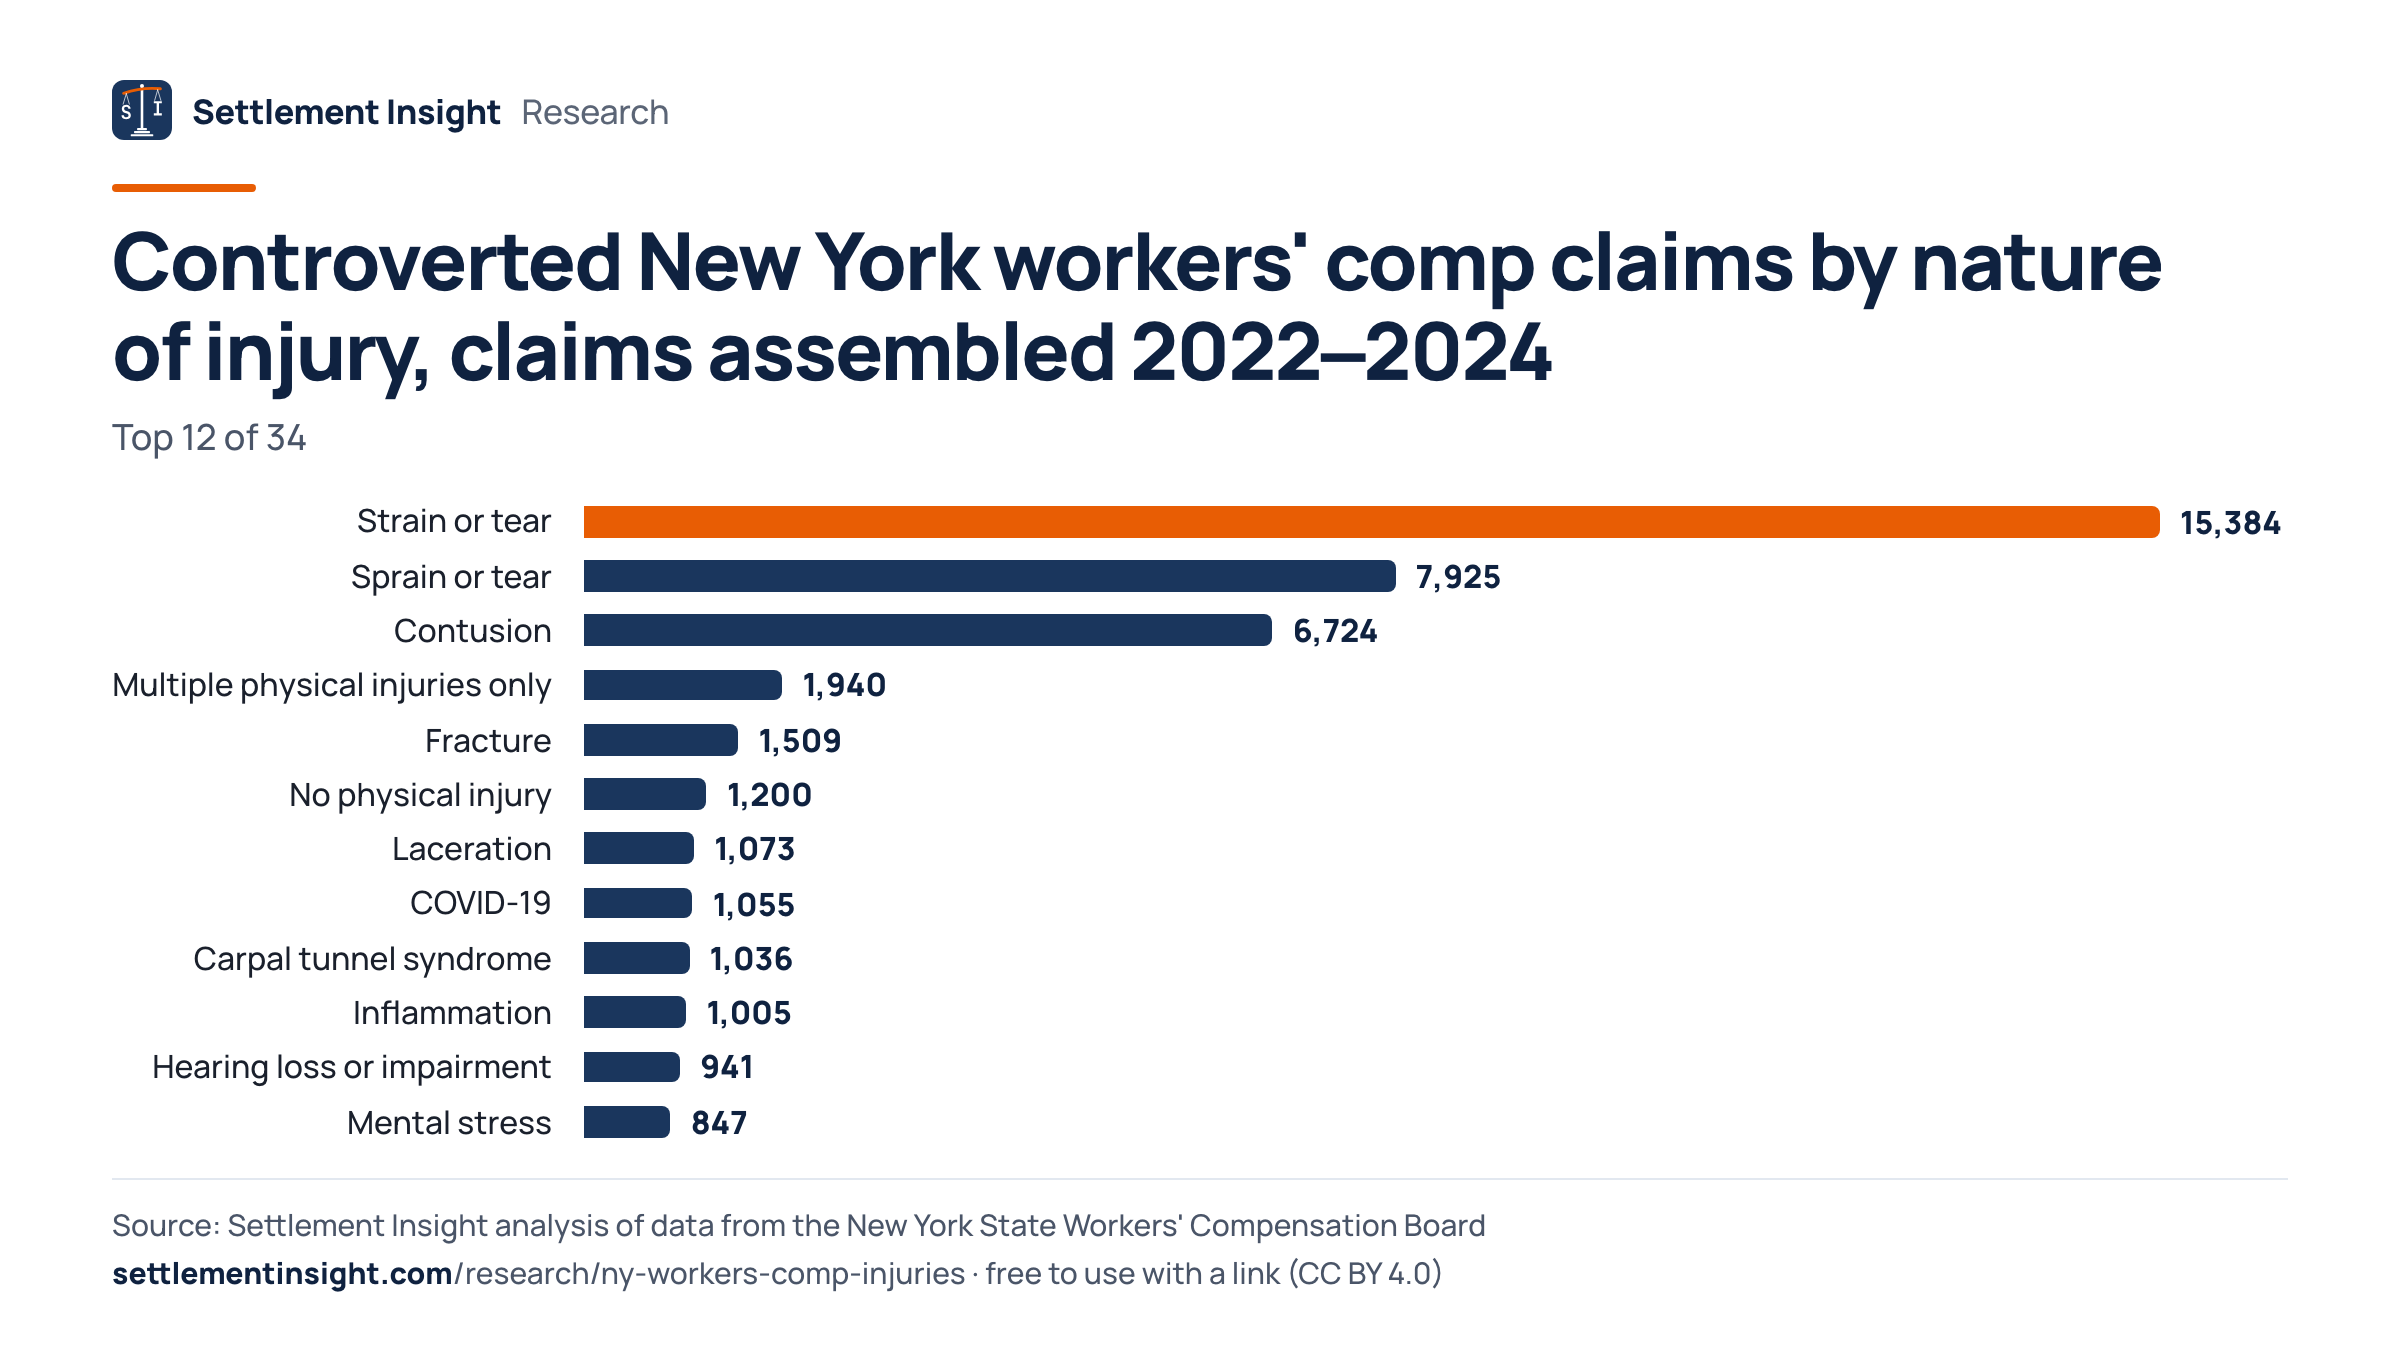
By number rather than share, everyday injuries dominate: strains or tears, sprains or tears and contusions together account for 57.0% of controverted claims.
Strains or tears (15,384), sprains or tears (7,925) and contusions (6,724) are the most frequently controverted injury types by count.
A low dispute share applied to a very common injury still produces many disputes. Of the 52,720 controverted claims assembled from 2022 to 2024, strains or tears account for 29.2% and contusions for 12.8%. Hearing-loss claims, with the highest shares, make up 2.6% of all disputes.
Controverted New York workers' comp claims by nature of injury, claims assembled 2022–2024
- Strain or tear15,3847.0% of 218,506 claims controverted
- Sprain or tear7,92510.8% of 73,273 claims controverted
- Contusion6,7243.9% of 170,812 claims controverted
- Multiple physical injuries only1,94013.0% of 14,899 claims controverted
- Fracture1,5095.9% of 25,774 claims controverted
- No physical injury1,20010.0% of 12,038 claims controverted
- Laceration1,0731.4% of 77,950 claims controverted
- COVID-191,0557.8% of 13,460 claims controverted
- Carpal tunnel syndrome1,03639.5% of 2,623 claims controverted
- Inflammation1,0056.1% of 16,564 claims controverted
All 34 injury types
- Hearing loss or impairment94143.2% of 2,180 claims controverted
- Mental stress84723.7% of 3,567 claims controverted
- Dislocation6129.8% of 6,230 claims controverted
- Loss of hearing42557.4% of 740 claims controverted
- Syncope40413.1% of 3,073 claims controverted
- Concussion3924.5% of 8,788 claims controverted
- Hernia33311.7% of 2,841 claims controverted
- Respiratory disorders27912.4% of 2,247 claims controverted
- Puncture2440.8% of 32,105 claims controverted
- Crushing2353.0% of 7,858 claims controverted
- Foreign body2121.8% of 11,715 claims controverted
- Burn2061.6% of 13,146 claims controverted
- Myocardial infarction14922.9% of 650 claims controverted
- Infection1298.4% of 1,538 claims controverted
- Mental disorder11118.7% of 594 claims controverted
- Rupture1109.3% of 1,180 claims controverted
- Multiple injuries including both physical and psychological10017.8% of 563 claims controverted
- Dermatitis734.6% of 1,573 claims controverted
- Amputation699.4% of 734 claims controverted
- Heat prostration549.7% of 556 claims controverted
- Contagious disease433.9% of 1,106 claims controverted
- Electric shock403.7% of 1,069 claims controverted
- Poisoning: chemical, (other than metals)385.9% of 645 claims controverted
- Poisoning: general (not od or cumulative294.1% of 703 claims controverted
Which Causes of Injury Are Most Often Disputed
Claims attributed to continual noise are controverted most often; collisions with another vehicle and falls from ladders or scaffolding stand out among sudden accidents.
Continual noise (48.4%), repetitive motion and vehicle collisions (21.2%) rank high; injuries caused by a fellow worker, patient or other person are rarely disputed (1.7%).
The cause-of-injury code describes how the injury happened. Among the 55 ranked causes with at least 500 claims, gradual causes rank near the top: continual noise (1,620 claims, 48.4% controverted) and repetitive-motion strains (23.3%).
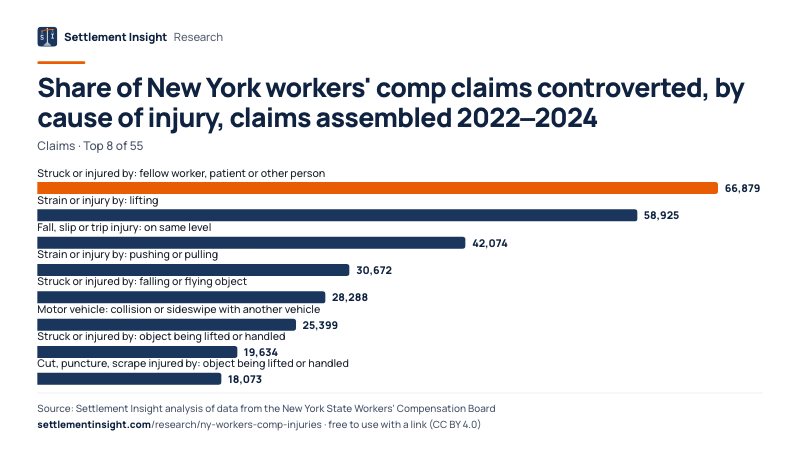
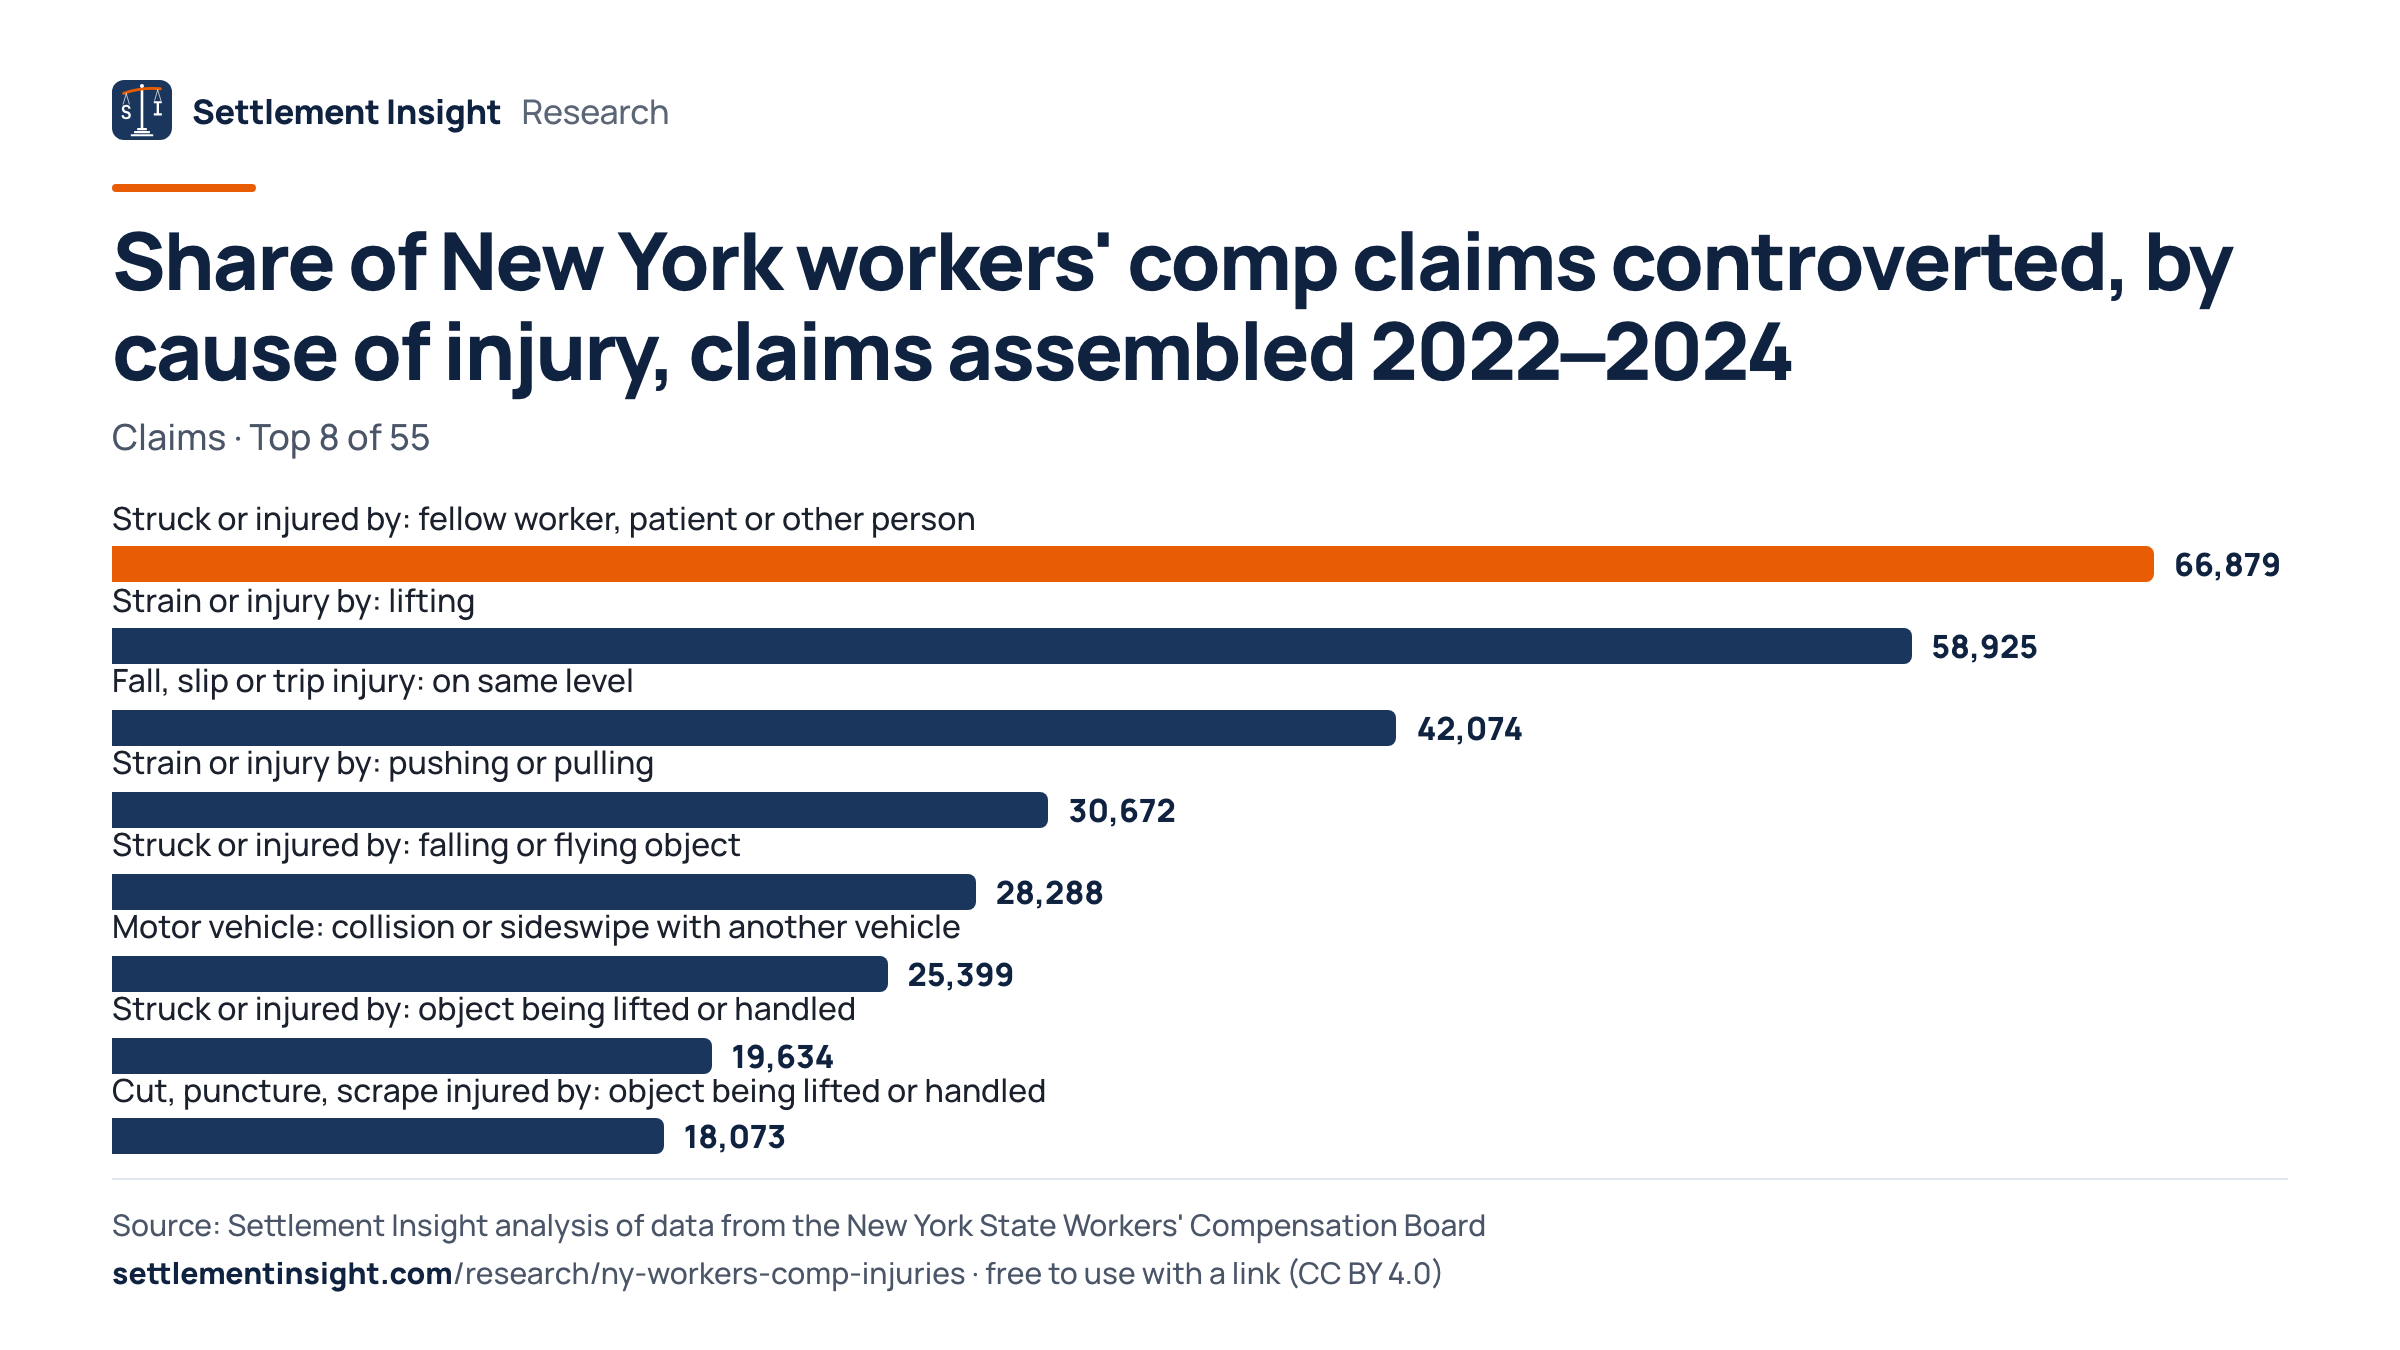
Among sudden events, carriers controverted 21.2% of the 25,399 claims for collisions or sideswipes with another vehicle and 20.6% of claims for falls from ladders or scaffolding. Lifting injuries were controverted in 5.8% of cases and injuries caused by a fellow worker, patient or other person in 1.7% of 66,879 claims. The data do not show the grounds for these disputes.
Share of New York workers' comp claims controverted, by cause of injury, claims assembled 2022–2024
| Cause | Claims | Share |
|---|---|---|
| Strain or injury by: continual noise | 1,620 | 48.4% |
| Rubbed or abraded by: repetitive motion | 1,249 | 29.5% |
| Strain or injury by: repetitive motion | 15,770 | 23.3% |
| Motor vehicle: collision or sideswipe with another vehicle | 25,399 | 21.2% |
| Fall, slip or trip injury: from ladder or scaffolding | 8,493 | 20.6% |
| Miscellaneous causes: other than physical cause of injury | 8,816 | 19.8% |
| Motor vehicle: crash of rail vehicle | 703 | 16.5% |
| Struck or injured by: motor vehicle | 5,536 | 12.9% |
| Burn or scald: heat or cold: dust, gases, fumes or vapors | 1,616 | 12.6% |
| Burn or scald: heat or cold: temperature extremes | 926 | 12.5% |
| Motor vehicle: vehicle upset | 798 | 9.8% |
| Pandemic: pandemic | 12,674 | 8.0% |
All 55 causes
| Cause | Claims | Share |
|---|---|---|
| Fall, slip or trip injury: from different level (elevation) | 15,309 | 7.7% |
| Strain or injury by: using tool or machinery | 3,609 | 6.8% |
| Miscellaneous causes: person in act of a crime | 8,423 | 6.8% |
| Motor vehicle: collision with a fixed object | 2,156 | 6.4% |
| Strain or injury by: reaching | 6,015 | 6.0% |
| Strain or injury by: lifting | 58,925 | 5.8% |
| Fall, slip or trip injury: into openings | 2,221 | 5.8% |
| Caught in, under or between: collapsing materials (slides of earth) | 680 | 5.6% |
| Strain or injury by: holding or carrying | 10,388 | 5.2% |
| Fall, slip or trip injury: on stairs | 16,699 | 5.0% |
| Strain or injury by: pushing or pulling | 30,672 | 5.0% |
| Fall, slip or trip injury: on same level | 42,074 | 5.0% |
| Strain or injury by: twisting | 15,962 | 4.9% |
| Striking against or stepping on: moving part of machine | 805 | 4.8% |
| Burn or scald: heat or cold: electrical current | 1,162 | 4.6% |
| Fall, slip or trip injury: slip, or trip, did not fall | 5,968 | 4.6% |
| Strain or injury by: wielding or throwing | 547 | 4.4% |
| Struck or injured by: falling or flying object | 28,288 | 4.1% |
| Strain or injury by: jumping or leaping | 2,114 | 4.1% |
| Burn or scald: heat or cold: chemicals | 3,182 | 3.8% |
| Striking against or stepping on: stepping on sharp object | 1,509 | 3.1% |
| Struck or injured by: object being lifted or handled | 19,634 | 3.1% |
| Struck or injured by: object handled by others | 6,071 | 3.0% |
| Fall, slip or trip injury: from liquid or grease spills | 14,487 | 3.0% |
| Burn or scald: heat or cold: fire or flame | 656 | 2.9% |
| Caught in, under or between: machine or machinery | 5,043 | 2.8% |
| Struck or injured by: hand tool or machine in use | 4,914 | 2.7% |
| Cut, puncture, scrape injured by: powered hand tool, appliance | 4,589 | 2.7% |
| Striking against or stepping on: stationary object | 17,697 | 2.7% |
| Burn or scald: heat or cold: cold objects or substances | 501 | 2.6% |
| Struck or injured by: moving parts of machine | 1,629 | 2.6% |
| Fall, slip or trip injury: on ice or snow | 13,573 | 2.5% |
| Striking against or stepping on: object being lifted or handled | 4,468 | 2.5% |
| Caught in, under or between: object handled | 12,302 | 2.0% |
| Miscellaneous causes: natural disasters | 662 | 1.8% |
| Struck or injured by: fellow worker, patient or other person | 66,879 | 1.7% |
| Miscellaneous causes: foreign matter (body) in eye(s) | 8,388 | 1.5% |
| Burn or scald: heat or cold: steam or hot fluids | 3,578 | 1.4% |
| Animal or insect: includes bite, sting or allergic reaction. | 12,219 | 1.3% |
| Cut, puncture, scrape injured by: object being lifted or handled | 18,073 | 1.2% |
| Burn or scald: heat or cold: hot objects or substances | 5,360 | 1.2% |
| Cut, puncture, scrape injured by: broken glass | 4,174 | 1.0% |
| Cut, puncture, scrape injured by: hand tool, utensil; not powered | 17,042 | 0.7% |
Cause labels combine the WCIO cause group and detail as the Board records them, for example "Strain or injury by: lifting".
How Many New York Workers' Comp Claims Are Controverted Each Year
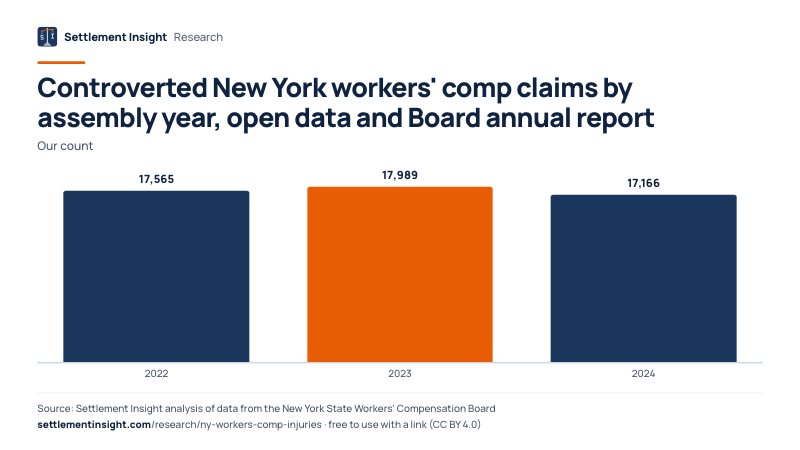
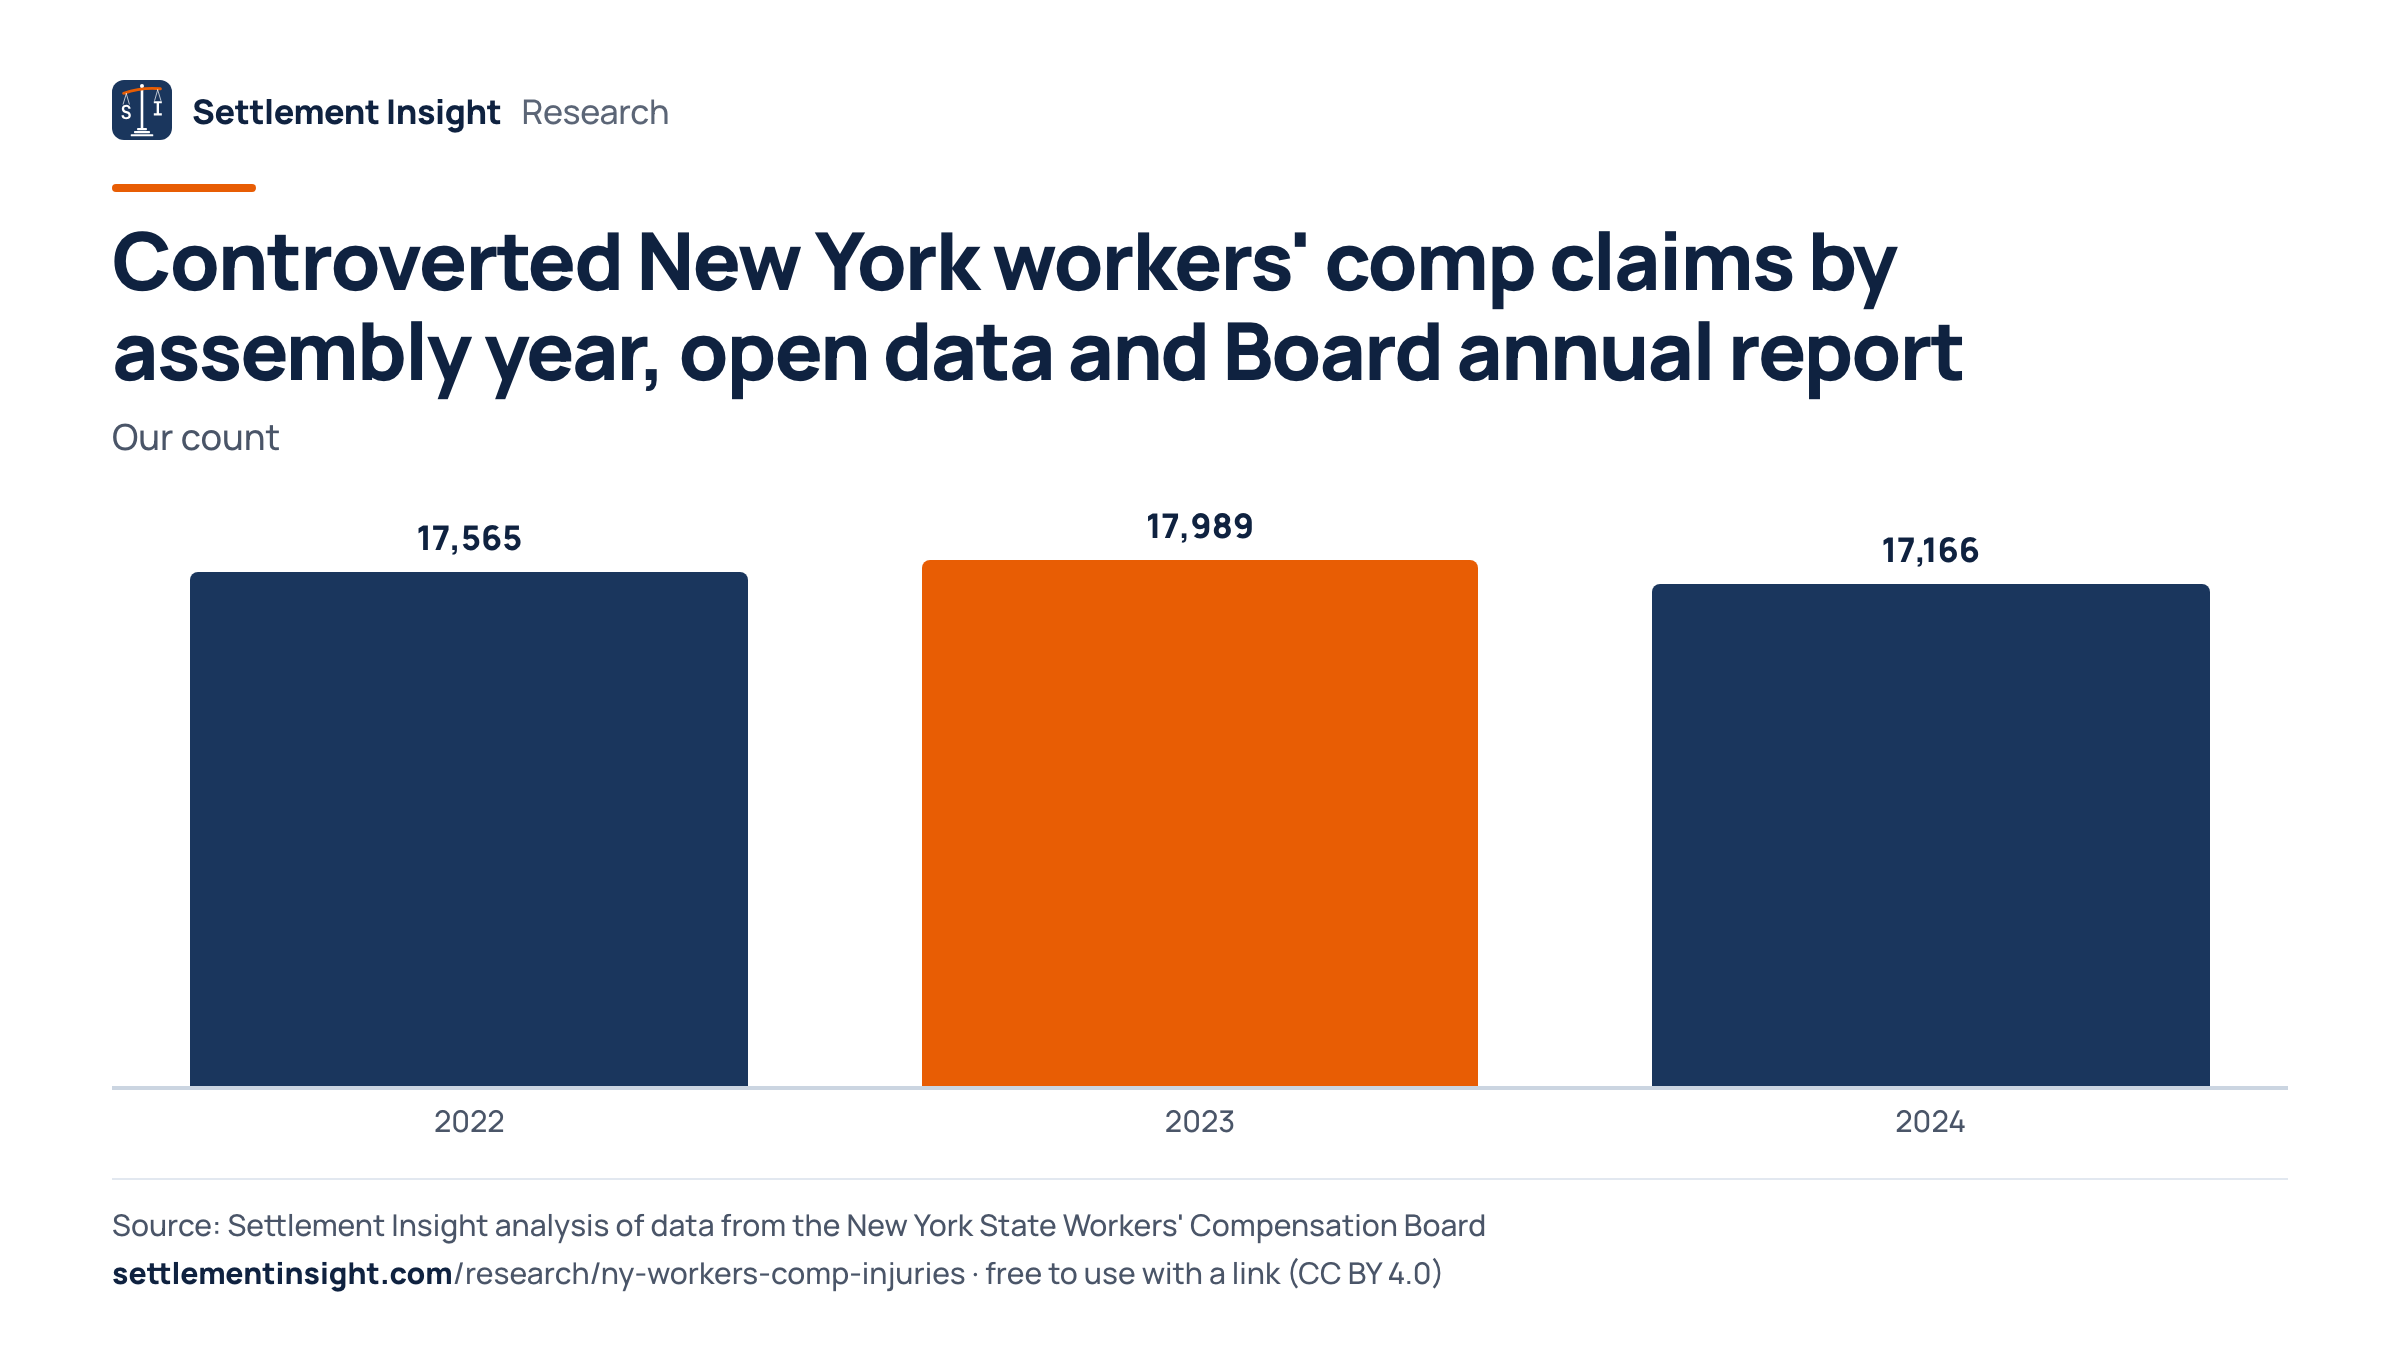
Between 17,166 and 17,989 claims assembled in each year from 2022 to 2024 were controverted, close to the counts the Board publishes.
17,565 claims assembled in 2022, 17,989 in 2023 and 17,166 in 2024 were controverted, each within 0.86% of the Board's published count.
The Board's 2025 Annual Report lists controverted claims by the year a claim was assembled: 17,415 for 2022, 18,008 for 2023 and 17,162 for 2024. Our counts from the open data differ by 0.86%, 0.11% and 0.02%. The report divides these counts by "complete" claims, which have both an insurer's notice and a qualifying medical document, and arrives at 10.4% for 2024. The open data contain every assembled claim, a larger number, so the shares in this study are lower than the Board's.
Controverted New York workers' comp claims by assembly year, open data and Board annual report
| Year | Our count | Board | Share |
|---|---|---|---|
| 2022 | 17,565 | 17,415 | 6.5% |
| 2023 | 17,989 | 18,008 | 6.8% |
| 2024 | 17,166 | 17,162 | 6.5% |
Share = controverted claims divided by all claims assembled in the open data for that year, not by the Board's smaller count of complete claims.
Download the Data and Cite This Study
Every table as a CSV file and in one Excel workbook, a short PDF summary and every chart as an image, free to reuse with attribution (CC BY 4.0).
- Controverted New York workers' comp claims by cause of injury, 2022–2024Claims assembled and claims controverted per WCIO cause-of-injury category above the minimum claim count stated in the method, with the controverted share overall and by assembly year. · 55 rows · CSV, 6 KB
- Controverted New York workers' comp claims by nature of injury, 2022–2024Claims assembled and claims controverted per WCIO nature-of-injury category above the minimum claim count stated in the method, with the controverted share overall and by assembly year. · 34 rows · CSV, 3 KB
- Controverted New York workers' comp claims by assembly year, 2022–2024Claims assembled and controverted per assembly year in the open data, next to the controverted count published in the Board's 2025 Annual Report. · 3 rows · CSV, 1 KB
- All tables in one Excel workbookOne sheet per table plus an About sheet with sources, method and citation · Excel (.xlsx), 18 KB
- Summary to print or forward (3 pages)Short answer, key figures, main chart, findings, method and citation · PDF, 252 KB
Charts for your story
Share of New York workers' comp claims controverted, by nature of injury, claims assembled 2022–2024
Embed this chart
Controverted New York workers' comp claims by nature of injury, claims assembled 2022–2024
Embed this chart
Share of New York workers' comp claims controverted, by cause of injury, claims assembled 2022–2024
Embed this chart
Controverted New York workers' comp claims by assembly year, open data and Board annual report
Embed this chart
How to cite
Goldberg, L. (2026). Controverted New York Workers' Compensation Claims — by nature and cause of injury and by year (claims assembled 2022–2024) [Data set]. Settlement Insight. https://settlementinsight.com/research/ny-workers-comp-injuries
BibTeX
@dataset{goldberg_2026_ny_workers_comp_injuries,
  author    = {Goldberg, Leonard},
  title     = {Controverted New York Workers' Compensation Claims --- by nature and cause of injury and by year (claims assembled 2022--2024)},
  year      = {2026},
  publisher = {Settlement Insight},
  url       = {https://settlementinsight.com/research/ny-workers-comp-injuries}
}How We Measured
Checked against published figures
- Controverted New York workers' compensation claims assembled in calendar year 2022: published 17,415, our count 17,565 (0.86% apart).New York State Workers' Compensation Board, 2025 Annual Report: Claims Assembled — Controverted vs. Not Controverted from 2020 to 2025
- Controverted New York workers' compensation claims assembled in calendar year 2023: published 18,008, our count 17,989 (0.11% apart).New York State Workers' Compensation Board, 2025 Annual Report: Claims Assembled — Controverted vs. Not Controverted from 2020 to 2025
- Controverted New York workers' compensation claims assembled in calendar year 2024: published 17,162, our count 17,166 (0.02% apart).New York State Workers' Compensation Board, 2025 Annual Report: Claims Assembled — Controverted vs. Not Controverted from 2020 to 2025
Full method and limits of the data
A claim counts as controverted if the Board recorded a controverted date, which it sets once both a notice of controversy from the carrier or self-insured employer and a qualifying medical report have arrived. We count controverted dates through September 30, 2026. Injury type and cause are the WCIO nature-of-injury and cause-of-injury codes in the Board's data. The rankings include every nature-of-injury or cause-of-injury code with at least 500 non-cancelled workers' compensation claims assembled in 2022–2024, counted per code across all three years. Blank codes and catch-all codes whose description contains "all other" or "NOC" (for example "all other cumulative injury, NOC" or "dust disease, NOC") are counted in the totals but not ranked; "no physical injury", "multiple physical injuries only" and "multiple injuries including both physical and psychological" are regular codes and are ranked. The Board uses two hearing codes, "hearing loss or impairment" and "loss of hearing"; each is ranked as its own injury type, and the combined hearing-loss figure adds them. At this threshold the smallest ranked injury types are heat prostration, multiple injuries including both physical and psychological, and mental disorder, while angina pectoris and vision loss fall just below it; the smallest ranked cause is contact with cold objects or substances.
The share for each category is controverted claims divided by all claims of that category assembled in the same years. To check the data, we compared controverted claims per assembly year with the Board's 2025 Annual Report table "Claims Assembled — Controverted vs. Not Controverted from 2020 to 2025": 17,166 against 17,162 for 2024 (0.02% apart), 17,989 against 18,008 for 2023 and 17,565 against 17,415 for 2022.
What this data cannot tell you
- The shares use all assembled claims as the base. The Board's annual report uses only complete claims, so its overall share is higher (10.4% for 2024, against 6.6% across 2022–2024 here). If incomplete claims are more common for some injury types than others, the ranking would shift somewhat.
- Controverted means disputed, not denied. The data used here do not show how the Board decided a dispute, whether benefits were later paid, or on what grounds the carrier objected.
- The Board does not assemble every reported injury: claims are assembled when a worker loses more than one week of work, has a serious injury, files a claim form or the claim is disputed. Minor injuries that never reach that point are not in the data.
- Controverted counts grow as claims mature, which is why claims assembled in 2025 and 2026 are left out; later updates of the dataset can add disputes for 2022–2024 claims as well. The rankings compare injury types without adjusting for industry, occupation, carrier or other differences between claims.
- Each claim carries one nature-of-injury and one cause-of-injury code as recorded in the Board's data; categories with fewer than 500 claims are not ranked, and their shares are less stable from year to year.
Frequently Asked Questions
Which workers' comp injuries are most often disputed in New York?
Among injury types with at least 500 claims, hearing loss tops the list: carriers controverted 46.8% of hearing-loss claims assembled from 2022 to 2024. Carpal tunnel syndrome (39.5%) and mental stress (23.7%) follow, while contusions (3.9%) and lacerations (1.4%) are rarely disputed.
What is a controverted workers' comp claim in New York?
A claim is controverted when the insurance carrier or self-insured employer files a notice disputing it and the Board has a qualifying medical report. The claim then goes to the expedited hearing process, which seeks to resolve it within 90 days.
How many New York workers' comp claims are controverted each year?
The Board reports 17,162 controverted claims among those assembled in 2024; our count from the open data is 17,166. Across all claims assembled from 2022 to 2024, 6.6% were controverted.
Is a controverted workers' comp claim the same as a denied claim?
No. Controverted means the carrier disputes the claim; a workers' compensation law judge then decides it. The data used here do not show how disputes ended.
Are hearing loss workers' comp claims disputed in New York?
Often. Of the 2,920 hearing-loss claims assembled from 2022 to 2024, 1,366 were controverted, 46.8%. By cause, claims attributed to continual noise were controverted in 48.4% of cases.
Are mental stress workers' comp claims disputed in New York?
Carriers controverted 23.7% of the 3,567 mental stress claims assembled from 2022 to 2024, more than three times the 6.6% share for all claims.
Sources
- Assembled Workers' Compensation Claims: Beginning 2000 — New York State Workers' Compensation Board (data.ny.gov)
- 2025 Annual Report — New York State Workers' Compensation Board
- Assembled Workers' Compensation Claims: Data Dictionary — New York State Workers' Compensation Board
- Assembled Workers' Compensation Claims: Overview — New York State Workers' Compensation Board
- Independent analysis. Settlement Insight is not a law firm and not affiliated with any agency named here. Analysis by Leonard Goldberg, Editor. How we work: methodology, our data.
More Research and Data
Other studies from our database of public legal records — each with free CSV downloads.
Related research
Latest studies
- Bank complaints closed with moneyBank of America, N.A. closed 36.0% of 2025 checking/savings complaints with money, top of firms with 500+
- Dental Data Breaches276 dental breach reports to HHS, 45.7 million individuals affected (sum of reports)
- Mental Health Data BreachesAt least 210 HHS breach reports from mental health and addiction providers, 10.3 million affected (summed)
- OFAC penalties by companyTen companies account for 75.2% of all OFAC penalty dollars since 2003